Code-Document Table
Video Tutorial: [Working with the Code-Document Table
You can use the Code-Document Table for within and across documents or group comparisons by relating codes or code groups and documents or document groups to each other.
The table cells contain:
-
frequency count of the number of codings. This can be different from the number of quotations, if a quotation is coded by multiple codes. Counted is each link between a code and a quotation.
-
word count of the quotations coded by the selected code or code group.
Running an Analysis in the Code-Document Table
From the main menu select Analysis > Code-Document Table.
Select codes or code groups for the table rows. The selected codes / code groups are added to the table.
Select documents or document groups for the table columns. The selected documents / document groups are added to the table.
How to make selections: To select an item, you need to click the check-box in front of it. It is also possible to select multiple items via the standard selection techniques using the Ctrl/Cmd or Shift-key. After highlighting multiple items, push the space bar to activate the check boxes of all selected items, or right click and chose Check Selected.
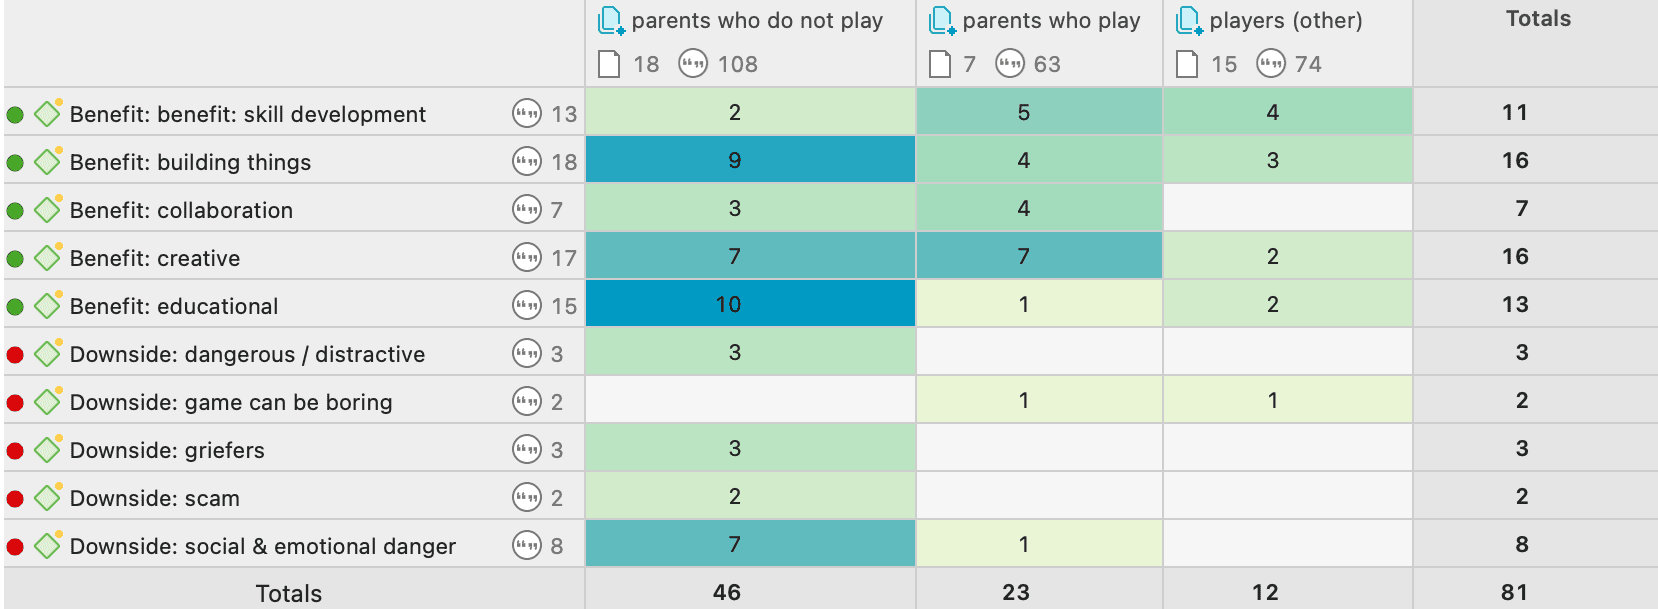
How to read the table
By default, the codes / code groups are displayed in the left column, and the documents / document groups in the top row.
Left column
-
Next to each code, the number indicates how often the code is applied in the entire project.
-
Next to a code group, you see two numbers: The first one tells you how many codes are in the group, the second numbers gives you the number of codings. This is different from the number of quotations, as multiple codes from the same code group could be linked to the same quotation.
Top row
-
Below a document, you see the total number of quotations in each document.
-
Below a document group, you see two numbers: the first one tells you how many documents are in the document group, and the second number gives you the number of quotations for all documents in the group.
The additional information you get for each selected row or column item allows you to better evaluate the numbers inside the table cells. If the value in the table cell is 10, but the code overall was applied 100 times, this leads to a different interpretation as if the code was only applied 12 times in the entire project.
Table cells
-
The results in the table cells show how often each selected code was (or the codes of a code group were) applied in each document or document group. Counted are the number of codings, unless you select to count words (see options).
-
If you click on a cell in the table, the quotation content is shown in the Quotation Reader on the left-hand side.
-
Below the table a Sankey Diagram is shown. You can see both at the same time, or view either the table or the Sankey Diagram. See below.
For further detail see the full manual.
Table Visualizations
Bar Chart
As soon as you create a table, a bar chart will be shown in the area below the table. If you hoover over a bar, the code (codegroup) - document (document group) pair will be shown.
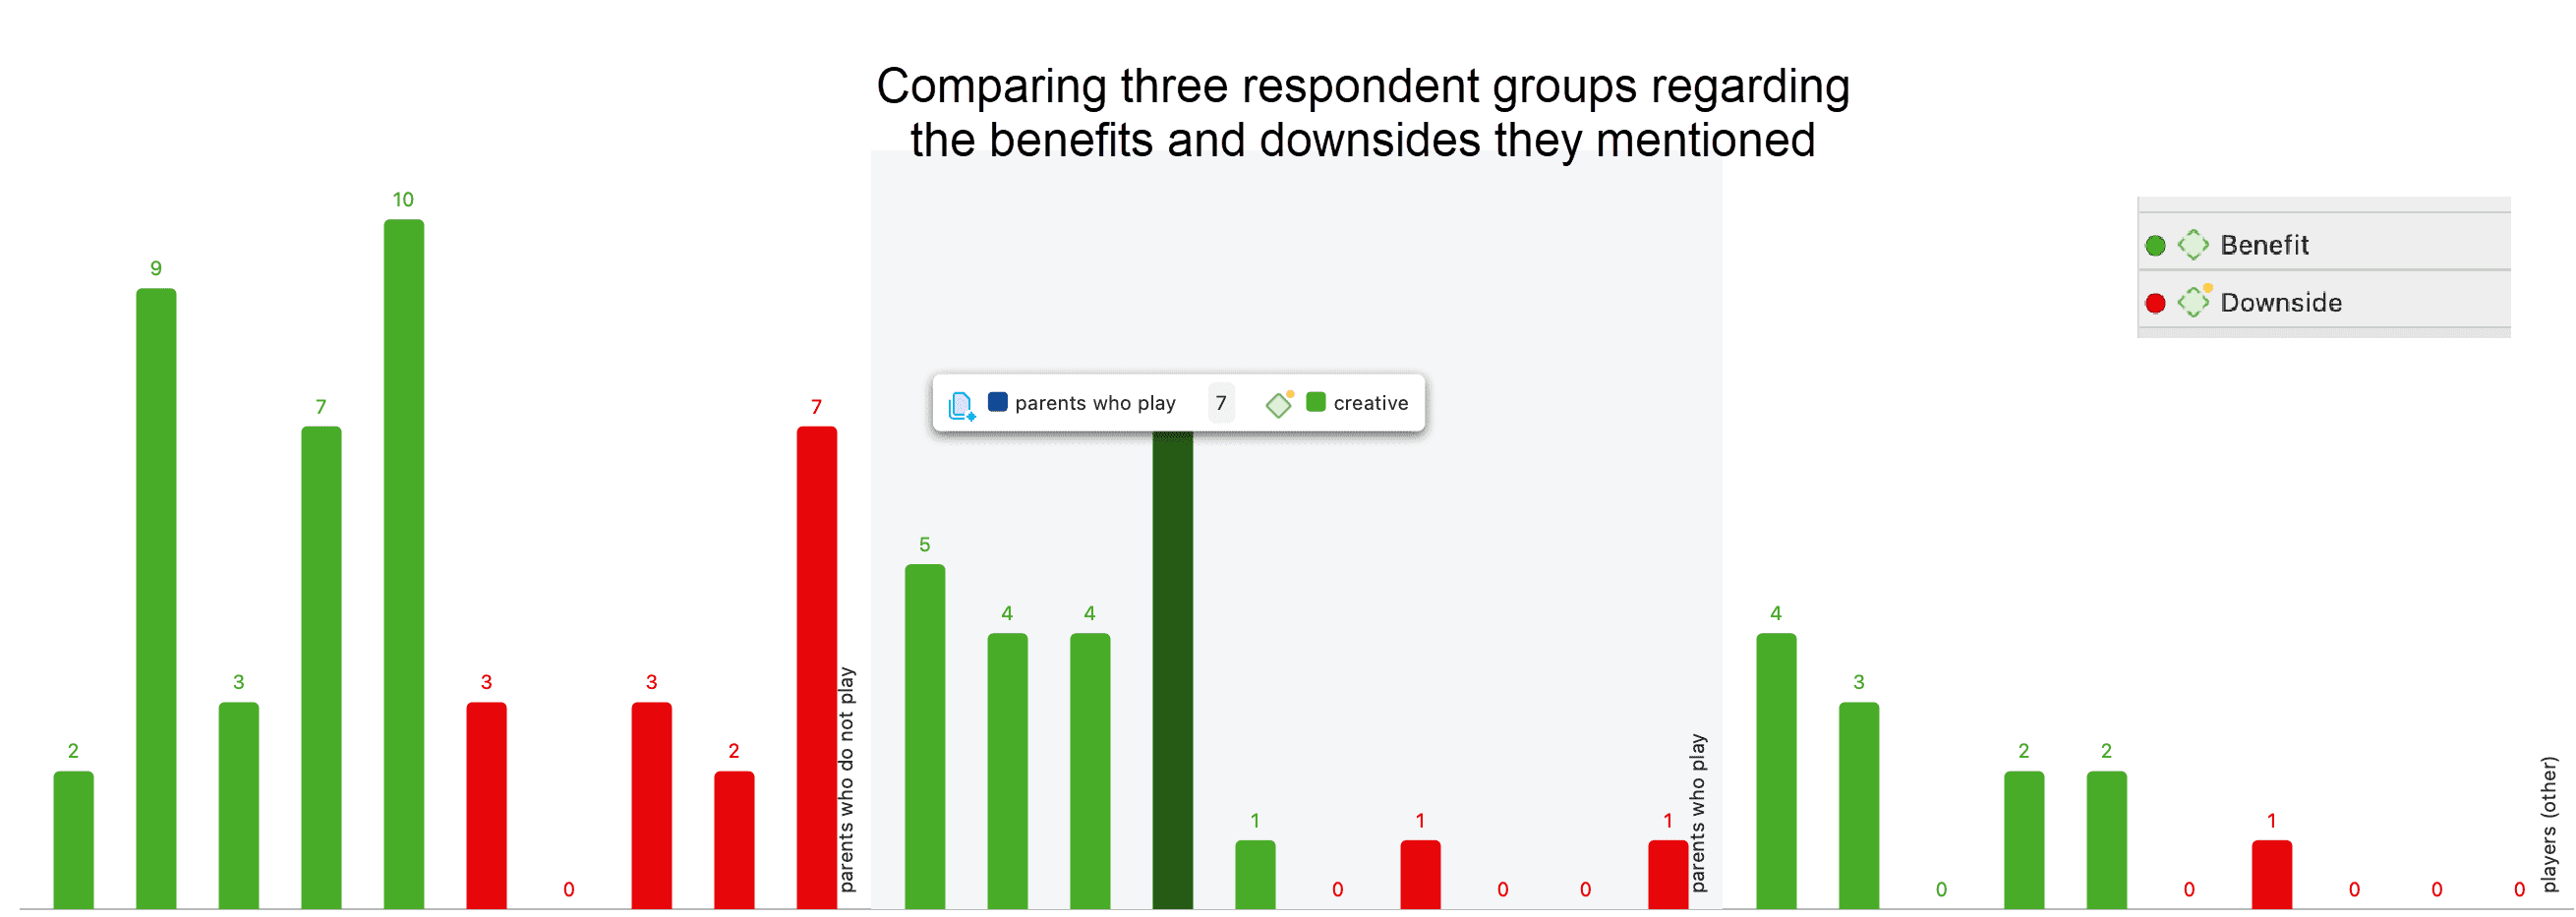
Depending on what you are visualizing, it can be useful to change the code colors. You may also want to switch around the rows and the columns. Open the *options in order to do this.
The table below shows the same comparison as above, only this time each subcode was given a different color. The subcodes for benefits range from green to blue; the subcodes for downside are red to yellow.
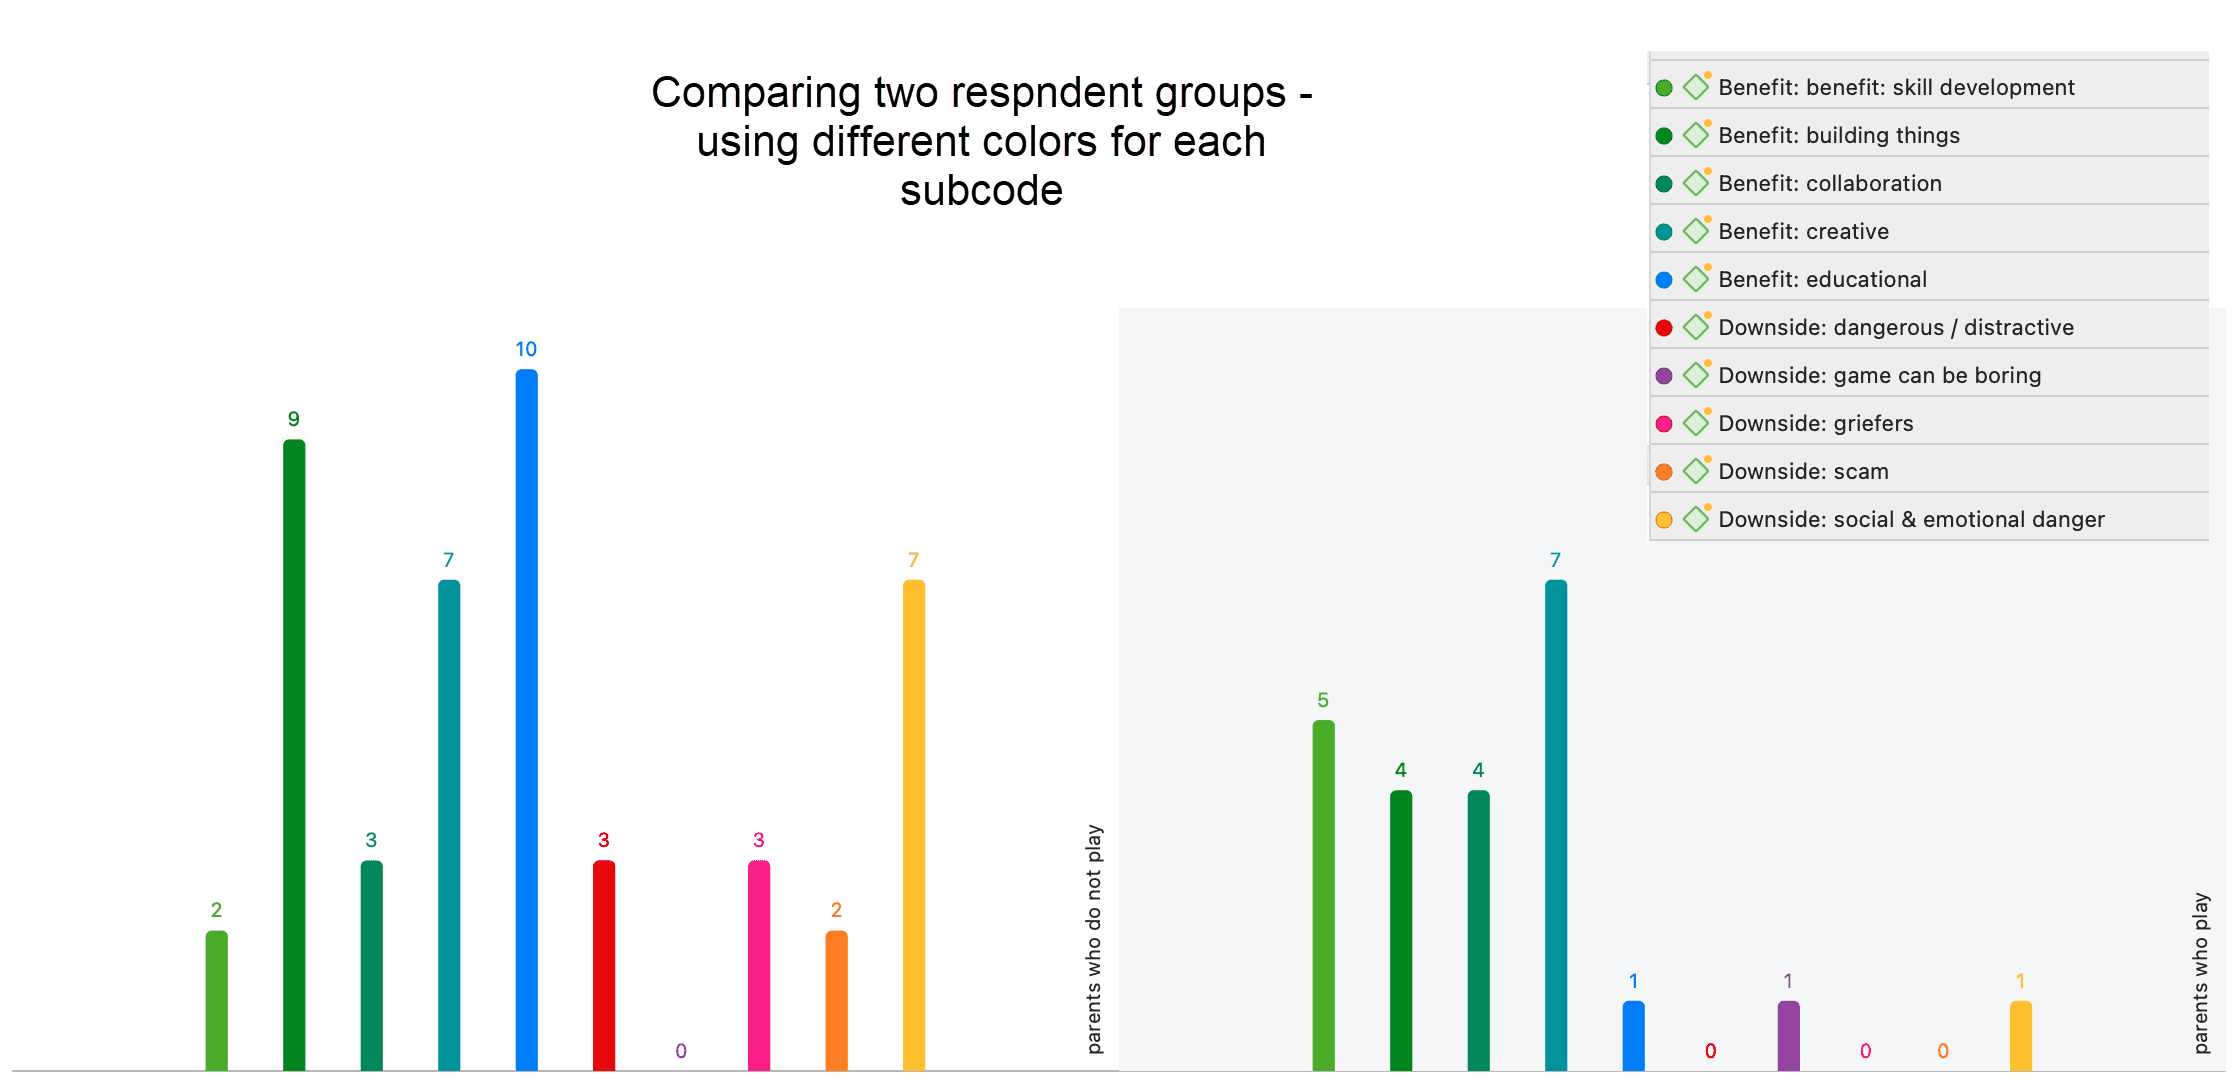
There is currently no legend. The one you see in the images are copy & pasted screenshots. Also, the code colours have to be changed manually. For a more convenient work with the graphics there will be further options in future updates.
Sankey Diagram
As soon as you create the Code-Document Table, a bar chart will be shown in the area below the table. To see a Sankey Diagram instead, click on the Sankey button in the toolbar.
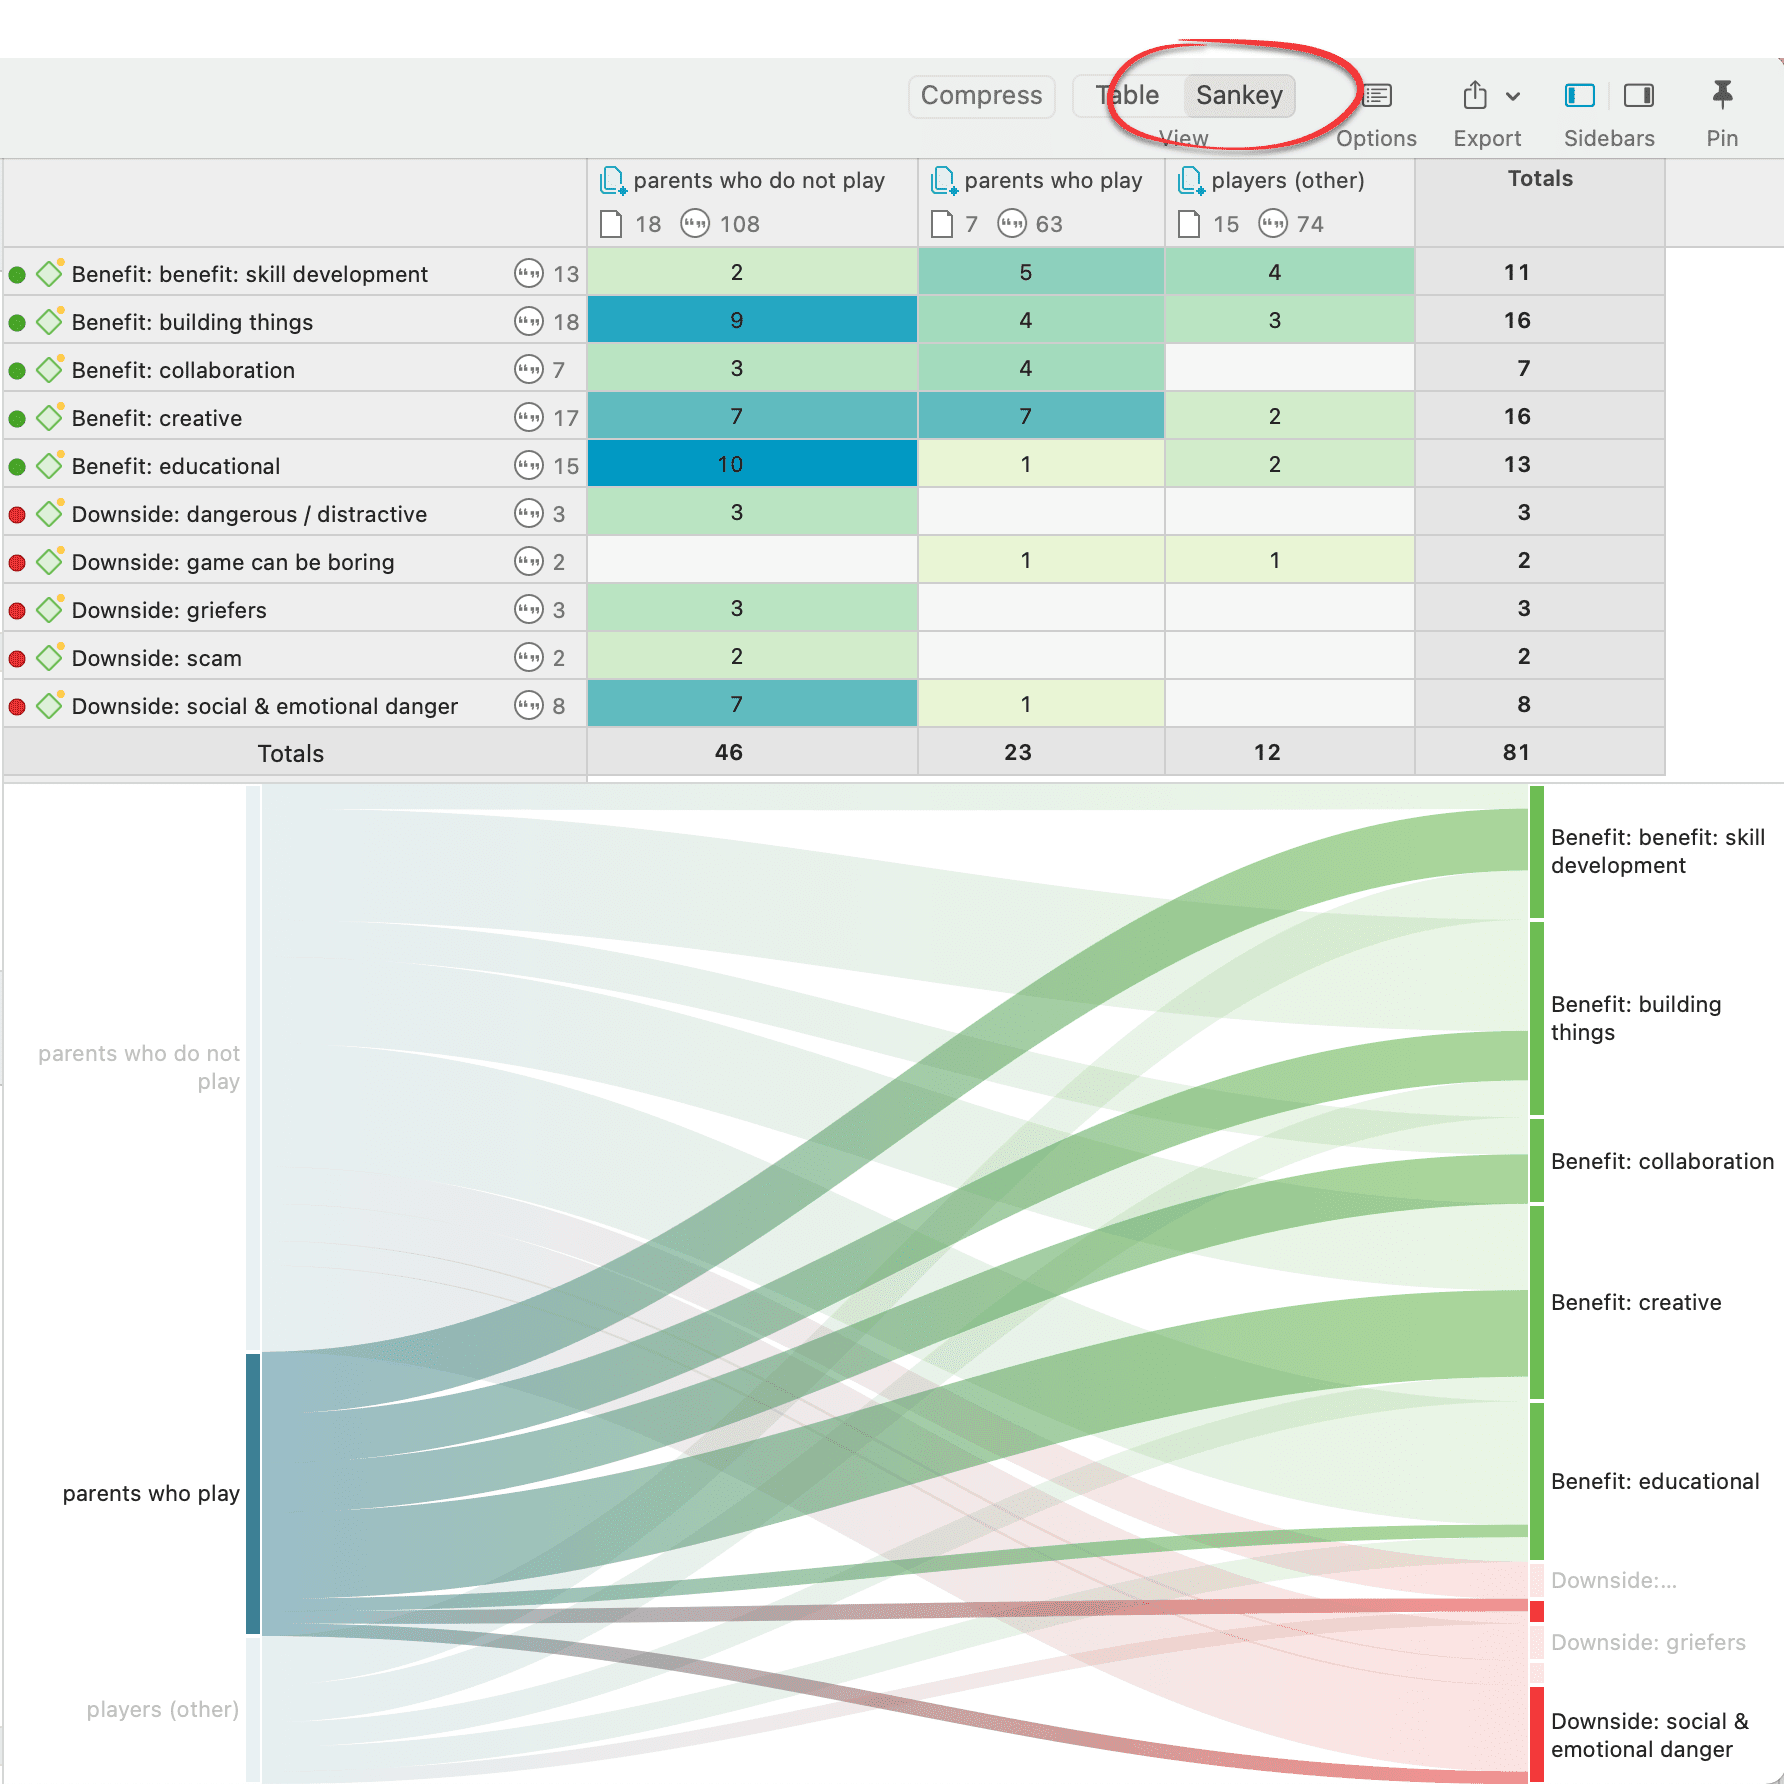 The row and column entities of the table are represented in the Sankey model as nodes and edges, showing the strength of co-occurrence between the pairs of nodes. In the Code-Document Table, the connecting pairs can consist of:
- codes - documents
- codes - document groups
- code groups - documents
- code groups - document groups
Edge: For each table cell containing a value, an edge is displayed between the diagram nodes. The thickness of the edges resemble the cell values of the table. Cells with value 0 are not displayed in the Sankey view.
The key to reading and interpreting Sankey Diagrams is to remember that the width is proportional to the quantity represented.
For further information read the chapter Visualizing the Code-Document Table in the full manual.
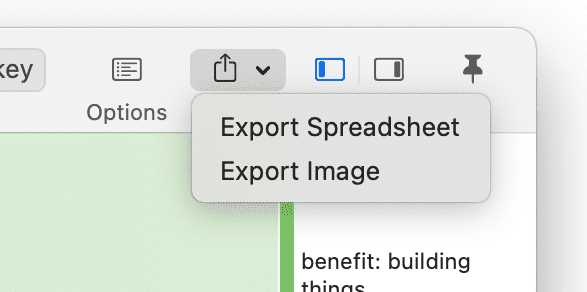
Export as Image
To save the Sankey diagram as image, click on the Export icon in the upper right-hand corner and select the option Export Image. The Sankey diagram will be saved in png format.