
Preface
ATLAS.ti 22 Quick Tour
Copyright © by ATLAS.ti Scientific Software Development GmbH, Berlin. All rights reserved.
Document version: 22.2.0.225 (09.01.2023 12:31:26)
Author: Dr. Susanne Friese
Copying or duplicating this document or any part thereof is a violation of applicable law. No part of this manual may be reproduced or transmitted in any form or by any means, electronic or mechanical, including, but not limited to, photocopying, without written permission from ATLAS.ti Scientific Software Development GmbH.
Trademarks: ATLAS.ti is a registered trademark of ATLAS.ti Scientific Software Development GmbH. Adobe Acrobat is a trademark of Adobe Systems Incorporated; Microsoft, Windows, Excel, and other Microsoft products referenced herein are either trademarks of Microsoft Corporation in the United States and/or in other countries. Google Earth is a trademark of Google, Inc. All other product names and any registered and unregistered trademarks mentioned in this document are used for identification purposes only and remain the exclusive property of their respective owners.
Please always update to the latest versions of ATLAS.ti when notified during application start.
About this Quick Tour
This Quick Tour describes the main functions of ATLAS.ti 22, so that you get a quick overview of how to use the software and get started with your analysis. If you need more detail or information about functions that are not described in this manual, you can always use the online help by pressing the F1 key.
Video Tutorial: Overview of ATLAS.ti 22 Windows.
It is not required that you read the manual sequentially from the beginning to the end. Feel free to skip sections that describe concepts you are already familiar with, jump directly to sections that describe functions you are interested in, or simply use it as a reference guide to look up information on certain key features.
The sequence of the chapters follows the steps that are necessary to start and work on an ATLAS.ti project. At first, we introduce you to the main concepts and give an overview of the main steps when analysing data with ATLAS.ti. Then we walk you through step-by-step:
- How to create a project and add documents.
- How to code you data.
- How to explore your data and write memos and comments.
- How to analyse your data and build conceptual networks.
- How to create reports.
Some general familiarity with concepts and procedures relating to the operating system and computing in general (e.g., selecting techniques, files, folders, paths) is assumed.
This is largely a technical document. You should not expect any detailed discussion of methodological aspects of qualitative research. However, you find some recommendations about how to code your data, how to build a coding system for a computer-assisted qualitative data analysis, or how to work with memos including references to academic sources. At the end of some chapter you find longer lists of articles, book chapters or books for further study.
Useful Resources for Getting Started
Video tutorials are available for each main topic. You find links to those tutorials at the beginning of the chapters introducing a new main topic.
To those seeking in-depth instruction on methodological aspects, the ATLAS.ti Training Center offers a full complement of dedicated ATLAS.ti training events worldwide, both through online courses and face-to-face seminars in nearly all parts of the world. Visit the ATLAS.ti Academy for more information.
ATLAS.ti Account and Licence Activation
For further information on Multi-User License Management, see our Guide for License Holders & Administrators.
Requesting a Trial Version
Go to https://my.atlasti.com/ to create an account.
Confirm your email address.
Request a trial license by clicking on Trial Desktop.
This brings you to the Cleverbridge Website.
Enter the required information and download the software.
If you do not want to download the software immediately, you can always do this later in your ATLAS.ti account. To do so, select My Applications.
The trial version can be used for 5 active days by one person on one computer within a period of 3 months. At the end of the test period, you can continue to use ATLAS.ti with limited functionality. If your project contains more than 10 documents, 50 quotations or 25 codes, you can no longer save any changes. Thus, ATLAS.ti then becomes a read-only version.
You can initiate the purchase of a full licence from your ATLAS.ti account. After activating the licence, and the program can be used again at full capacity. You can also continue to work on your project without any data loss.
You cannot install a trial version again on the same computer.
Activating a Licence
You need to make an online connection at least once to activate your licence. Once the account it activated, you can work offline and no further online connection is required. Please note, if you are using a seat that is part of a multi-user licence, you will blog the seat if you are offline.
If you have purchased an individual license from the ATLAS.ti web shop, your license has been added to your account. The next step is to activate it.
Similarly, if you are a member of a team of users under a multi-user license, you have received a license key, an invitation code, or invitation link from the person who manages the license.
The ATLAS.ti License Management System allocates seats of multi-user license dynamically. This means, you are assigned the first free seat under your license. If all seats are occupied, you will be allocated the next seat that opens up.
Log in to your ATLAS.ti account.
Navigate to License Management (the default page) and enter either the license key, or the invite code that you were given by the license owner/license manager.
Click Activate License.
Start ATLAS.ti on your computer and click Check For Updated License and follow the on-screen instructions to complete a few easy steps to activate your license.
Your installation is now activated, and you can start using ATLAS.ti.
Accessing Your Account from within ATLAS.ti
On the opening screen, click on the user avatar. If you have not added a picture yet, it will show the first two letters of your account name.
Click on Manage Account. This takes you to the login screen. Enter your log-in information (email and password) to access your account.
Logging Out
It is important to understand that the installation of ATLAS.ti is independent of the licencing of the software. You can have ATLAS.ti installed on as many computers as you want. A single-user licence gives you the right to use it on two computers, e.g. your desktop computer at the office and your laptop at home; or your Windows computer and your Mac computer; or the Cloud version and a desktop version. If you want to use ATLAS.ti on a third computer, or if you get a new computer, make sure you log out at the computer that you do no longer want to use. If you have been invited to use a multi-user license, you will have one seat for the time when using ATLAS.ti.
There are two ways how to log out to free a seat:
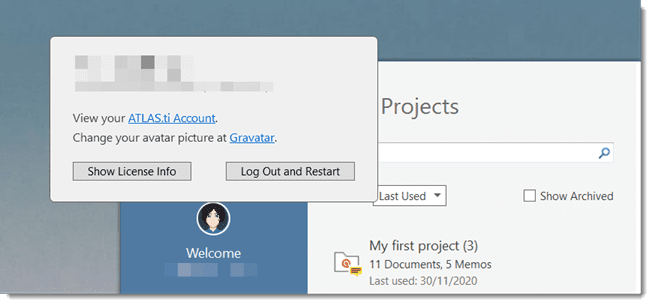
Click on the user avatar in the welcome screen and click Log Out and Restart.
If you forgot to log out in ATLAS.ti, you can always access your user account via a web browser:
Go to https://my.atlasti.com/. Enter your email address and password to log in.
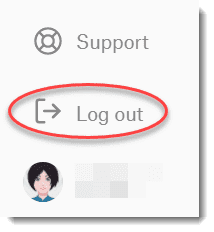
Select the Log Out option at the bottom left above your avatar in your ATLAS.ti account.
Working Off-Line
When starting ATLAS.ti, it checks whether you have a valid licence. If you know that you won't have online-access for a given period, you can set your licence to off-line work for a specified period.
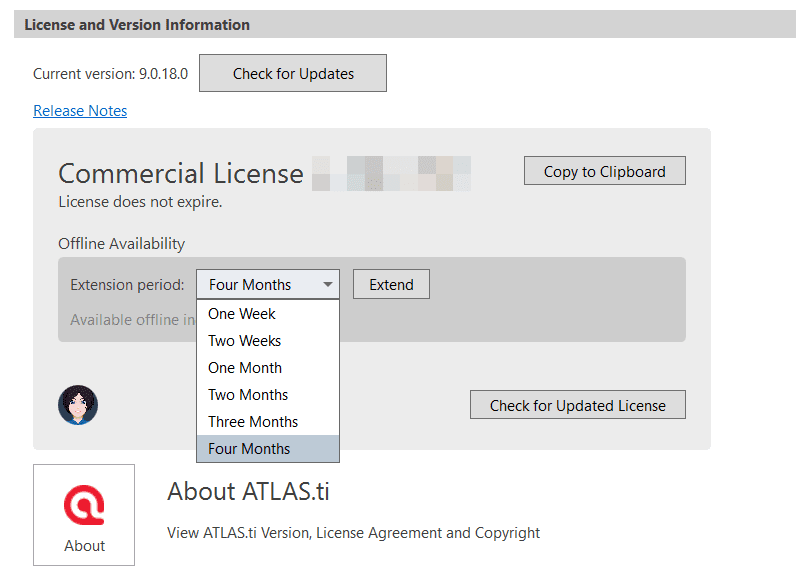
If you have a licence that does not expire, the maximum off-line period is four months. If you have a lease licence, the maximum period is dependent on the expiration date of your lease. This means, if your licence expires in 1 month, you cannot set the offline period to an additional 3 months.
To set your licence to off-line use, select Options on the Welcome Screen.
Click on the ATLAS.ti icon to review your current licence settings and select a period for offline availability.
 After the period expired, you need to connect to the Internet again to verify your licence.
Limited Version after Licence Expiration
Once the trial period or a time limited licence expire, the program is converted into a limited version. You can open, read and review projects, but you can only save projects that do not exceed a certain limit (see below). Thus, you can still use ATLAS.ti as a read-only version.
You cannot install a trial version again on the same computer.
Restrictions of the Limited Version
- 10 primary documents
- 50 quotations
- 25 codes
- 2 memos
- 2 network views
- auto backup is disabled
Introduction
ATLAS.ti is a powerful workbench for the qualitative analysis of larger bodies of textual, graphical, audio, and video data. It offers a variety of tools for accomplishing the tasks associated with any systematic approach to unstructured data, i.e., data that cannot be meaningfully analyzed by formal, statistical approaches. In the course of such a qualitative analysis, ATLAS.ti helps you to explore the complex phenomena hidden in your data. For coping with the inherent complexity of the tasks and the data, ATLAS.ti offers a powerful and intuitive environment that keeps you focused on the analyzed materials. It offers tools to manage, extract, compare, explore, and reassemble meaningful pieces from large amounts of data in creative, flexible, yet systematic ways.
Video Tutorial: Overview of ATLAS.ti 22 Windows.
The VISE Principle
The main principles of the ATLAS.ti philosophy are best encapsulated by the acronym VISE, which stands for
- Visualization
- Immersion
- Serendipity
- Exploration
Visualization
The visualization component of the program means directly supports the way human beings think, plan, and approach solutions in creative, yet systematic ways.
Tools are available to visualize complex properties and relations between the entities accumulated during the process of eliciting meaning and structure from the analyzed data.
The process is designed to keep the necessary operations close to the data to which they are applied. The visual approach of the interface keeps you focused on the data, and quite often the functions you need are just a few mouse clicks away.
Immersion
Another fundamental design aspect of the software is to offer tools that allow you to become fully immersed in your data. No matter where you are in the software, you always have access to the source data. Reading and re-reading your data, viewing them in different ways and writing down your thoughts and ideas while you are doing it, are important aspects of the analytical process. And, it is through this engagement with the data that you develop creative insights.
Serendipity
Webster's Dictionary defines serendipity as a seeming gift for making fortunate discoveries accidentally. Other meanings are: Fortunate accidents, lucky discoveries. In the context of information systems, one should add: Finding something without having actually searched for it.
The term serendipity can be equated with an intuitive approach to data. A typical operation that relies on the serendipity effect is browsing. This information-seeking method is a genuinely human activity: When you spend a day in the local library (or on the World Wide Web), you often start with searching for particular books (or keywords). But after a short while, you typically find yourself increasingly engaged in browsing through books that were not exactly what you originally had in mind - but that lead to interesting discoveries.
Examples of tools and procedures ATLAS.ti offers for exploiting the concept of serendipity are the Search & Code Tools, the Word Clouds and Lists, the Quotation Reader, the interactive margin area, or the hypertext functionality.
Exploration
Exploration is closely related to the above principles. Through an exploratory, yet systematic approach to your data (as opposed to a mere bureaucratic handling), it is assumed that especially constructive activities like theory building will be of great benefit. The entire program's concept, including the process of getting acquainted with its particular idiosyncrasies, is particularly conducive to an exploratory, discovery-oriented approach.
Areas of Application
ATLAS.ti serves as a powerful utility for qualitative analysis of textual, graphical, audio, and video data. The content of these materials is in no way limited to any one particular field of scientific or scholarly investigation.
Its emphasis is on qualitative, rather than quantitative, analysis, i.e., determining the elements that comprise the primary data material and interpreting their meaning. A related term would be "knowledge management," which emphasizes the transformation of data into useful knowledge.
ATLAS.ti can be of great help in any field where this kind of soft data analysis is carried out. While ATLAS.ti was originally designed with the social scientist in mind, it is now being put to use in areas that we had not really anticipated. Such areas include psychology, literature, medicine, software engineering, user experience research, quality control, criminology, administration, text linguistics, stylistics, knowledge elicitation, history, geography, theology, and law, to name just some of the more prominent.
Emerging daily are numerous new fields that can also take full advantage of the program's facilities for working with graphical, audio, and video data. A few examples:
- Anthropology: Micro-gestures, mimics, maps, geographical locations, observations, field notes
- Architecture: Annotated floor plans
- Art / Art History: Detailed interpretative descriptions of paintings or educational explanations of style
- Business Administration: Analysis of interviews, reports, web pages
- Criminology: Analysis of letters, fingerprints, photographs, surveillance data
- Geography and Cultural Geography: Analysis of maps, locations
- Graphology: Micro comments to handwriting features.
- Industrial Quality Assurance: Analyzing video-taped user-system interaction
- Medicine and health care practice: Analysis of X-ray images, CAT scans, microscope samples, video data of patient care, training of health personal using video data
- Media Studies: Analysis of films, TV shows, online communities
- Tourism: Maps, locations, visitor reviews
Many more applications from a host of academic and professional fields are the reality. The fundamental design objective in creating ATLAS.ti was to develop a tool that effectively supports the human interpreter, particularly in handling relatively large amounts of research material, notes, and associated theories.
Although ATLAS.ti facilitates many of the activities involved in qualitative data analysis and interpretation (particularly selecting, tagging data, and annotating), its purpose is not to fully automate these processes. Automatic interpretation of text cannot succeed in grasping the complexity, lack of explicitness, or contextuality of scientific or everyday knowledge. In fact, ATLAS.ti was designed to be more than a single tool - think of it as a professional workbench that provides a broad selection of effective tools for a variety of problems and tasks.
ATLAS.ti - The Knowledge Workbench
The image of ATLAS.ti as a knowledge workbench is more than just a lively analogy. Analytical work involves tangible elements: research material requires piecework, assembly, reworking, complex layouts, and some special tools. A well-stocked workbench provides you with the necessary instruments to thoroughly analyze and evaluate, search and query your data, to capture, visualize and share your findings.
Some Basic Terms
To understand how ATLAS.ti handles data, visualize your entire project as an intelligent container that keeps track of all your data. This container is your ATLAS.ti project.
The project keeps track of the paths to your source data and stores the codes, code groups, networks, etc. that you develop during your work. Your source data files are copied and stored in a repository. The standard option is for ATLAS.ti to manage the documents for you in its internal database. If you work with larger audio or video files, they can be linked to your project to preserve disk space. All files that you assign to the project (except those externally linked) are copied, i.e., a duplicate is made for ATLAS.ti's exclusive use. Your original files remain intact and untouched in their original location.
Your source data can consist of text documents (such as interview or focus group transcripts, reports, observational notes); images (photos, screenshots, diagrams),audio recordings (interviews, broadcasts, music), video clips (audiovisual material), PDF files (papers, brochures, reports, articles or book chapters for a literature review), geo data (locative data using Open Street Map), tweets from a Twitter query, and social network comments.
Once your various documents are added or linked to an ATLAS.ti project, your real work can begin. Most commonly, early project stages involve coding different data sources.
Selecting interesting segments in your data and coding them is the basic activity you engage in when using ATLAS.ti, and it is the basis of everything else you will do. In practical terms, coding refers to the process of assigning codes to segments of information that are of interest to your research objectives. We have modeled this function to correspond with the time-honored practice of marking (underlining or highlighting) and annotating text passages in a book or other documents.
In its central conceptual underpinnings, ATLAS.ti has drawn deliberately from what might be called the paper and pencil paradigm. The user interface is designed accordingly, and many of its processes are based on - and thus can be better understood by - this analogy.
Because of this highly intuitive design principle, you will quickly come to appreciate the margin area as one of your most central and preferred work space - even though ATLAS.ti almost always offers a variety of ways to accomplish any given task.
General Steps when Working with ATLAS.ti
The following sequence of steps is, of course, not mandatory, but describes a common script:
-
Create a project, an idea container, meant to enclose your data, all your findings, codes, memos, and structures under a single name. See Creating a New Project.
-
Next, add documents, text, graphic, audio and video files, or geo documents to your ATLAS.ti project. See Adding Documents.
-
Organize your documents. See Working With Groups.
-
Read and select text passages or identify areas in an image or select segments on the timeline of an audio or video file that are of further interest, assign keywords (codes), and write comments and memos that contain your thinking about the data. Build a coding system. See Working With Comments And Memos and Coding Data - Basic Concepts.
-
Compare data segments based on the codes you have assigned; possibly add more data files to the project. See for example Retrieving Coded Data.
-
Query the data based on your research questions utilizing the different tools ATLAS.ti provides. The keywords to look for are: simple retrieval, complex code retrievals using the Query Tool, simple or complex retrievals in combination with variables via the scope button, applying global filters, the Code Co-occurrence Tools (tree explorer and table), the Code Document Table, data export for further statistical analysis. See Data Analysis and Data Export For Further Statistical Analysis.
-
Conceptualize your data further by building networks from the codes and other entities you have created. These networks, together with your codes and memos, form the framework for emerging theory. See Working With Networks.
-
Finally, compile a written report based on the memos you have written throughout the various phases of your project and the networks you have created. See Working With Comments And Memos and Exporting Networks.
For additional reading about working with ATLAS.ti, see The ATLAS.ti Research Blog and The ATLAS.ti conference proceedings.
Main Steps in Working with ATLAS.ti
Data and Project Management
A first important but often neglected aspect of a project is data and project management. The first step is data preparation. You find more information on supported file formats in the section Supported File Formats.
Apart from analyzing your data, you also manage digital content, and it is important to know how the software does it. For detailed information, see the section on Project Management.
If you work in a team, please read the following section: Team Work.
Two Principal Modes of Working
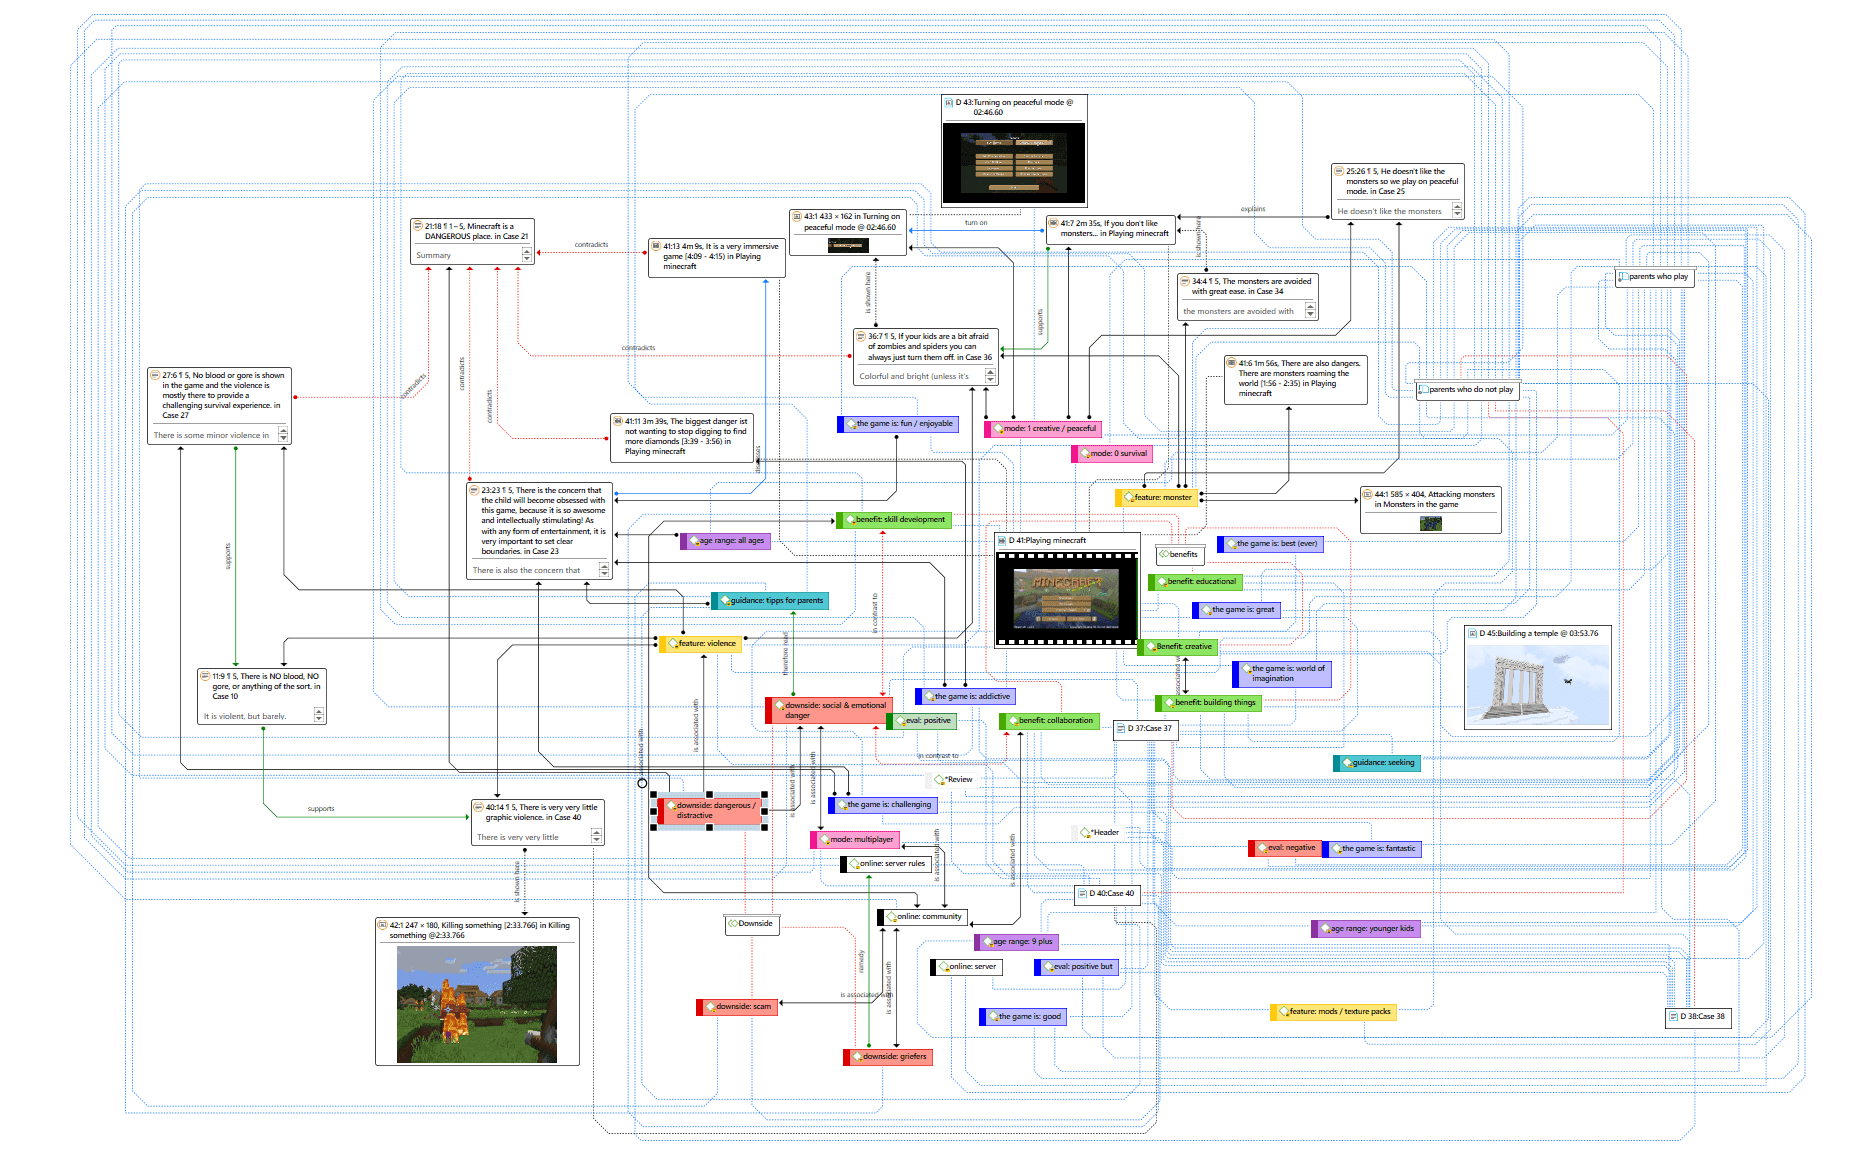
There are two principal modes of working with ATLAS.ti, the data level and the conceptual level. The data level includes activities like segmentation of data files; coding text, image, audio, and video passages; and writing comments and memos. The conceptual level focuses on querying data and model-building activities such as linking codes in networks, in addition to writing some more comments and memos.
The figure below illustrates the main steps, starting with the creation of a project, adding documents, identifying interesting things in the data and coding them. Memos and comments can be written at any stage of the process, whereas there is possibly a shift from writing comments to more extensive memo writing during the latter stages of the analysis. Once your data is coded, it is ready to be queried using the various analysis tools provided. The insights gained can then be visualized using the ATLAS.ti network function.
Some steps need to be taken in sequence. For instance, logic dictates that you cannot query anything or look for co-occurrences if your data has not yet been coded. But other than that there are no strict rules.
Data Level Work
Data-level activities include Exploring Data using word clouds and word lists, segmenting the data that you have assigned to a project into quotations, adding comments to respective passages note-making/annotating, linking data segments to each other called hyperlinking in ATLAS.ti, and coding data segments and memos to facilitate their later retrieval. The act of comparing noteworthy segments leads to a creative conceptualization phase that involves higher-level interpretive work and theory-building.
ATLAS.ti assists you in all of these tasks and provides a comprehensive overview of your work as well as rapid search, retrieval, and browsing functions.
Within ATLAS.ti, initial ideas often find expression through their assignment to a code or memo, to which similar ideas or text selections also become assigned. ATLAS.ti provides the researcher with a highly effective means for quickly retrieving all data selections and notes relevant to one idea.
Conceptual Level Work
Beyond coding and simple data retrieval, ATLAS.ti allows you to query your data in lots of different ways, combining complex code queries with variables, exploring relationships between codes and to visualize your findings using the network tool.
ATLAS.ti allows you to visually connect selected passages, memos, and codes into diagrams that graphically outline complex relations. This feature virtually transforms your text-based work space into a graphical playground where you can construct concepts and theories based on relationships between codes, data segments, or memos.
This process sometimes uncovers other relations in the data that were not obvious before and still allows you the ability to instantly revert to your notes or primary data selection. - For more detail, see Querying Data and Working With Networks.
Creating a New Project
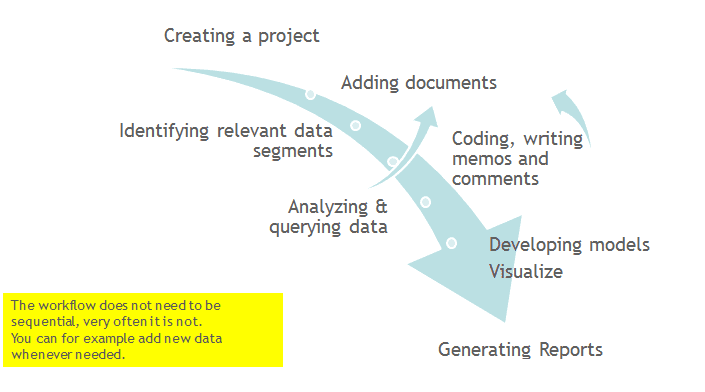
Video Tutorial: Creating a project and adding data. If you just started ATLAS.ti,
In the opening window on the left-hand side of the screen click on the button: Create New Project.
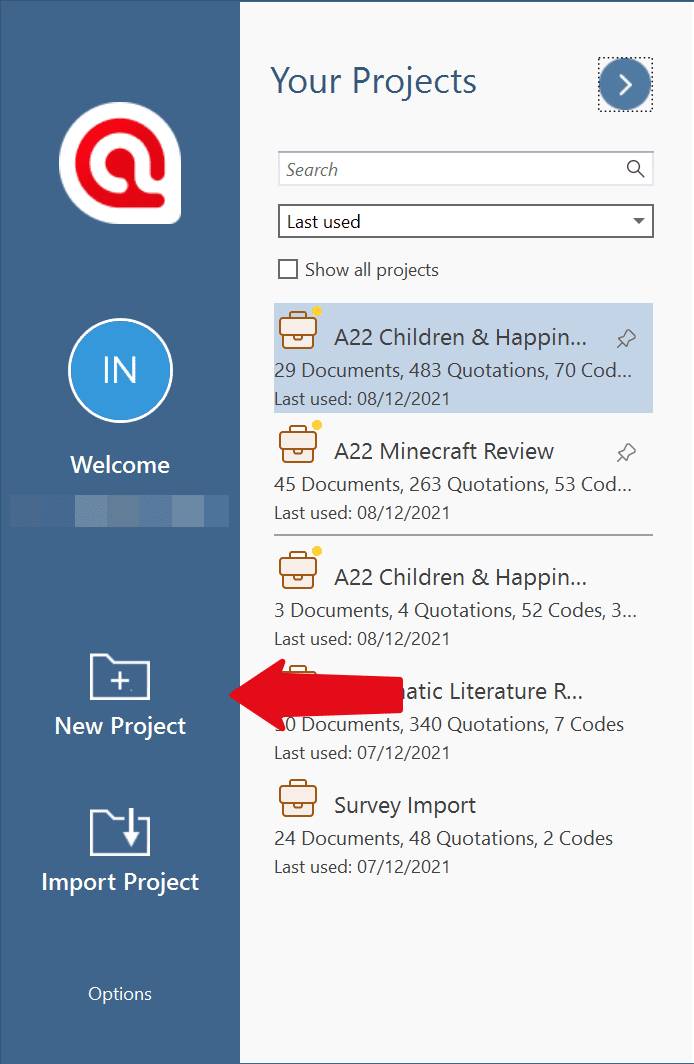
Enter a name for the project, optionally a comment, and click on Create.
If a project is already open,
click on File > New to open the backdrop. From there select Create New Project. Enter a name for the project, optionally a comment, and click on Create.
Supported File Formats
In principle, most textual, graphical, and multimedia formats are supported by ATLAS.ti. For some formats, their suitability depends on the state of your Windows system. Before deciding to use an exotic data format, you should check if this format is available and if it is sufficiently supported by your Windows system.
Textual Documents
The following file formats are supported:
| Format | File Type |
|---|---|
| MS Word | .doc; .docx; .rtf |
| Open Office | .odt |
| HyperText Markup Language | .htm; .html |
| Plain text | .txt |
| other | .ooxml |
Text documents can be edited in ATLAS.ti. This is useful to correct transcription errors, to change formatting, or to add missing information. When adding an empty text document to an ATLAS.ti project, you can also transcribe your data in ATLAS.ti. We however recommend using a dedicated transcription tool or use automated transcriptions. You can add transcripts with timestamps and synchronize them with the original audio or video file. For this you use Multimedia Transcripts.
Transcripts
ATLAS.ti supports virtually all transcription apps and services, and also allows you to transcribe within ATLAS.ti, or import transcripts that you wrote yourself. See Transcription for more details.
PDF files (Text and Graphic)
PDF files are perfect if you need the original layout. When PDF was invented, its goal was to preserve the same layout for onscreen display and in print.
If the PDF file has annotations, they are displayed in ATLAS.ti. However, they cannot be edited.
When preparing PDFs, you need to pay attention that you prepare a text PDF file and not a graphic PDF. If you do the latter, then ATLAS.ti treats it as a graphic file, and you cannot search it or retrieve text.
When scanning a text from paper, you need to use character recognition software (OCR, frequently provided with your scanner) in order to create a text PDF file. Another option is to apply character recognition in your PDF reader/writer software.
When you retrieve text from a coded PDF segment the output will be rich text. Thus, you may lose the original layout. This is due to the nature of PDF as mentioned above. It is a layout format and not meant for text processing.
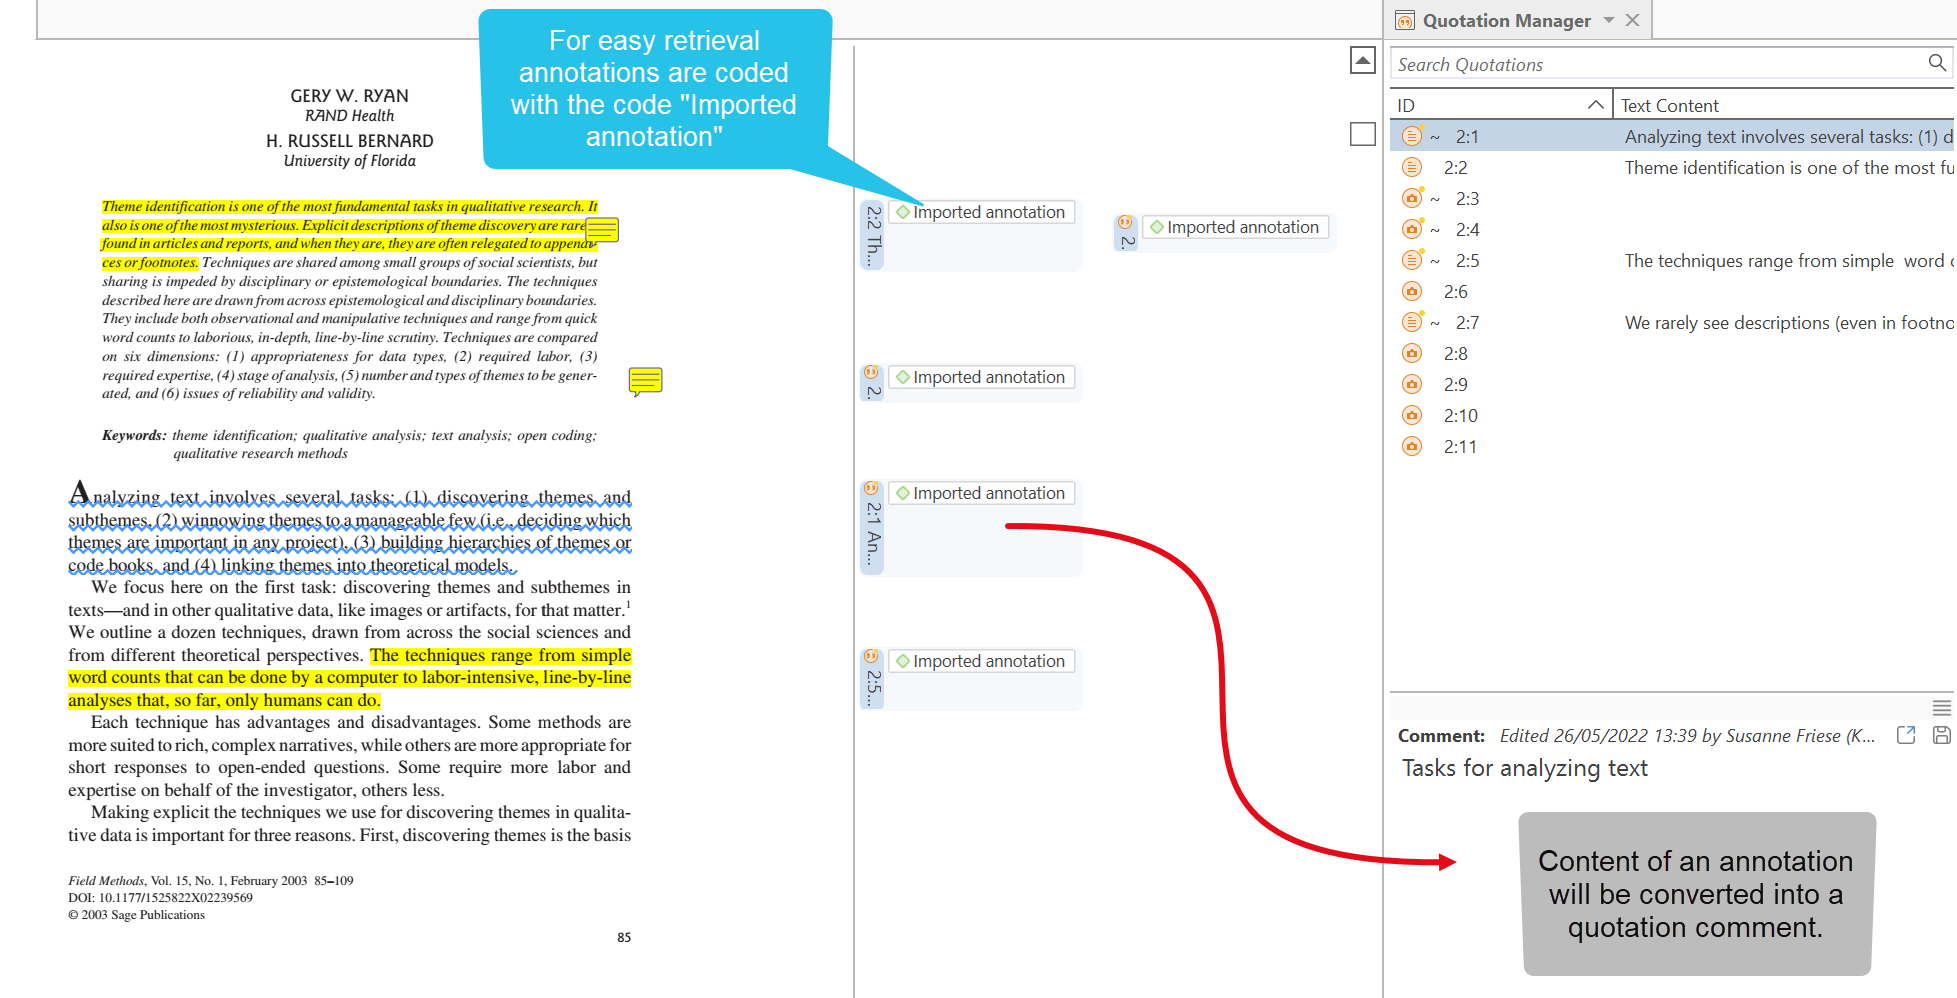
PDF with annotations / Word files with comments
If you have made annotations in Word or PDF files, ATLAS.ti will turn the highlighted area into a quotation. The text of the annotation will be added as a comment to the quotation.
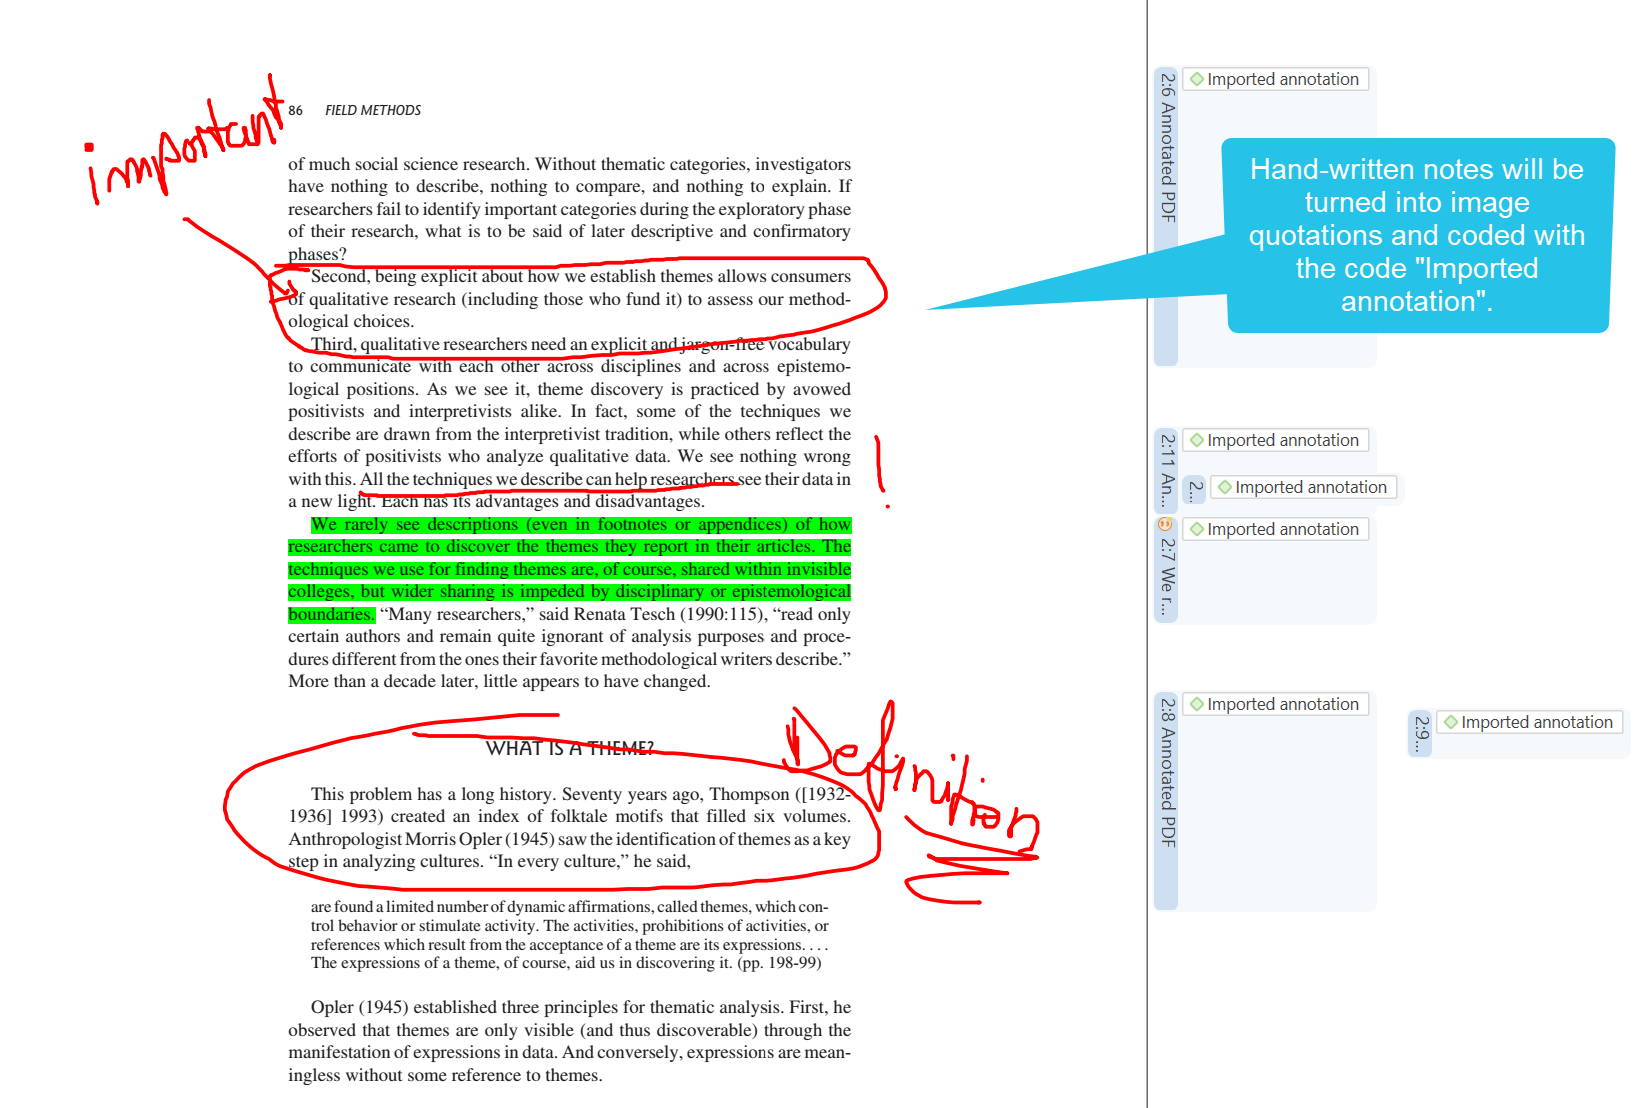
If you added handwritten drawings or comments, those will be imported as image quotations (in ATLAS.ti Windows currently only supported for PDF documents).
-
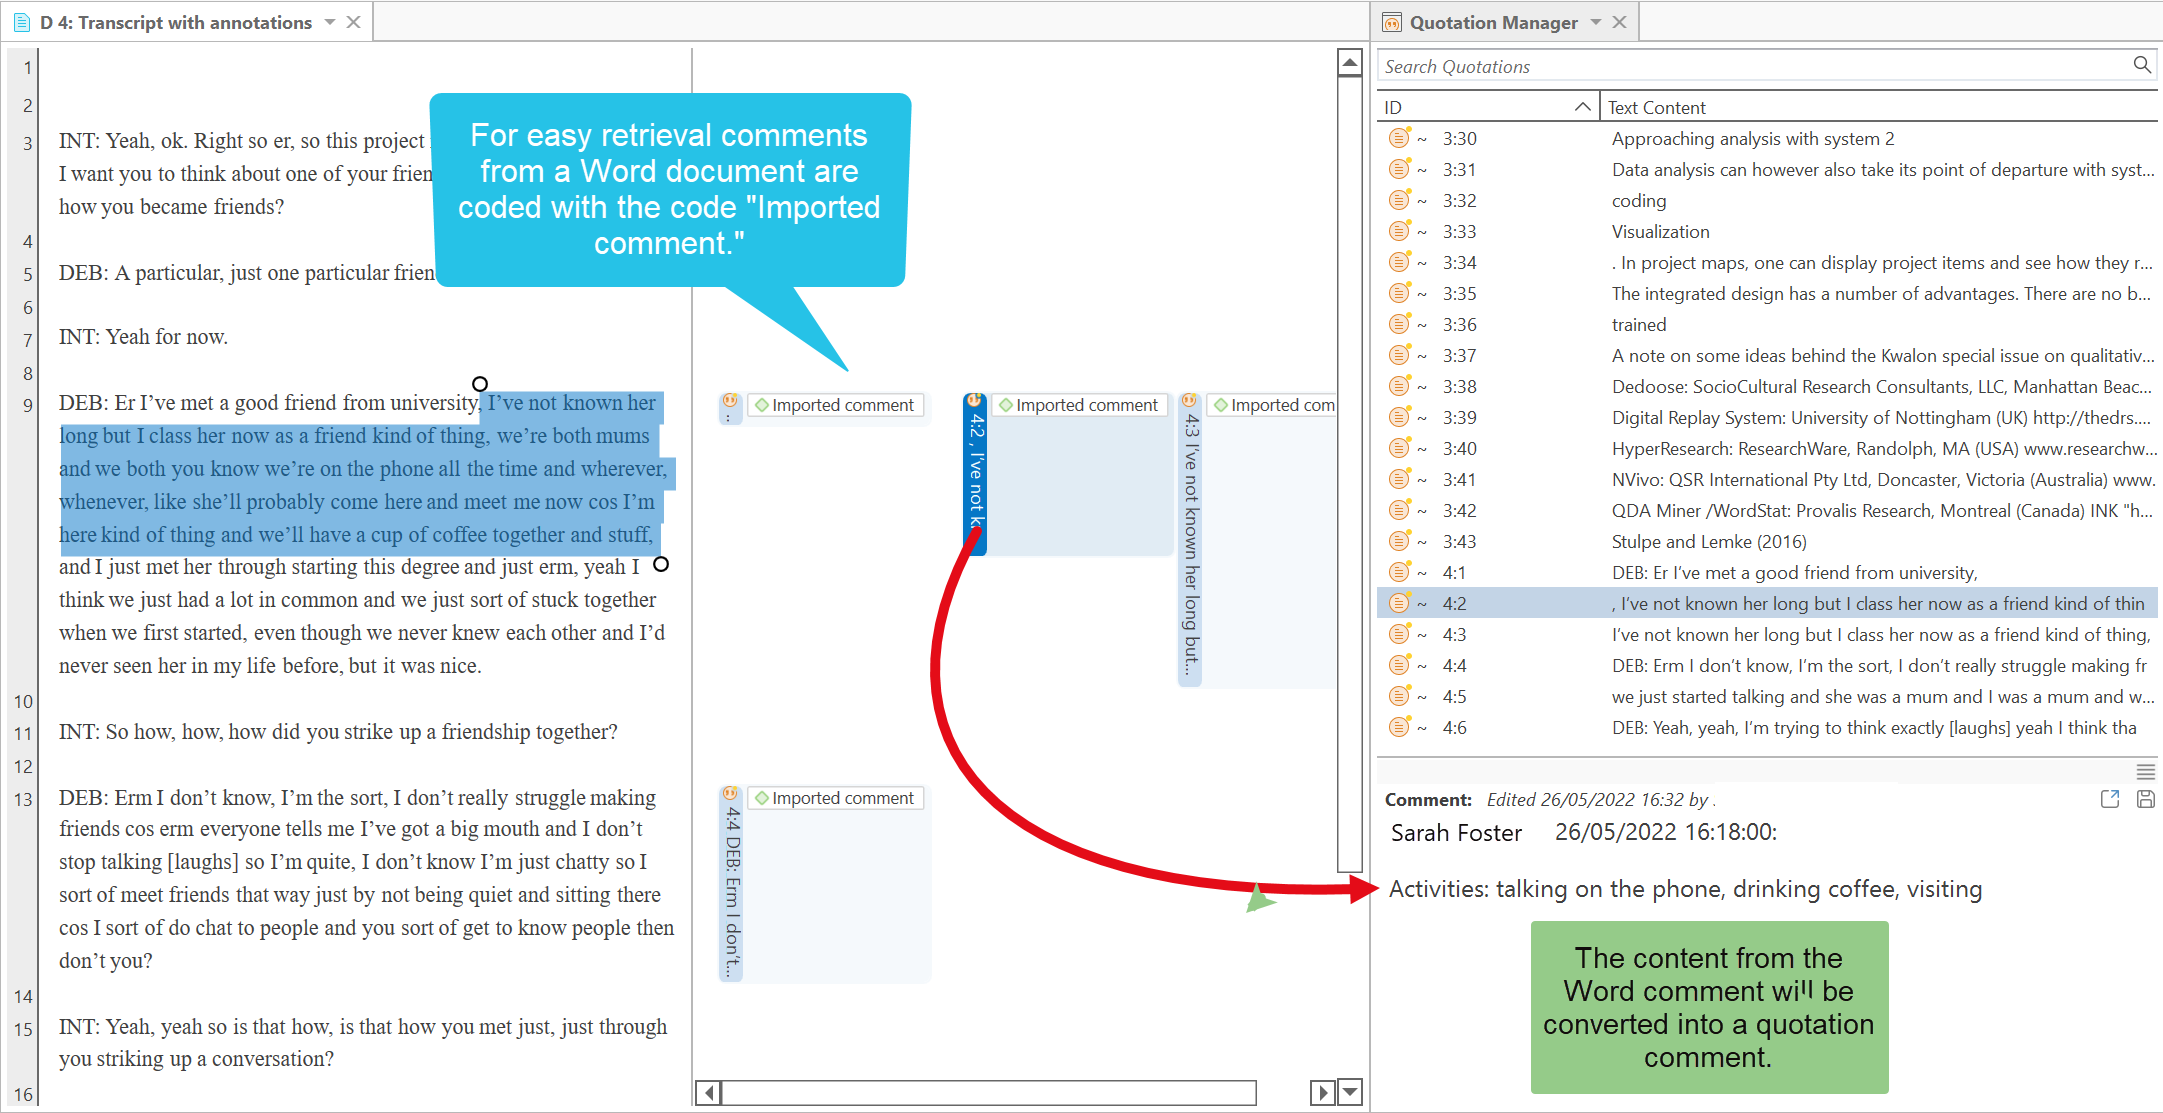
Imported comments from Word will be coded with the code Imported comments.
-
Imported comments from PDF documents will be coded with the code Imported annotations.
PDF documents with annotations imported in ATLAS.ti
Word document with comments
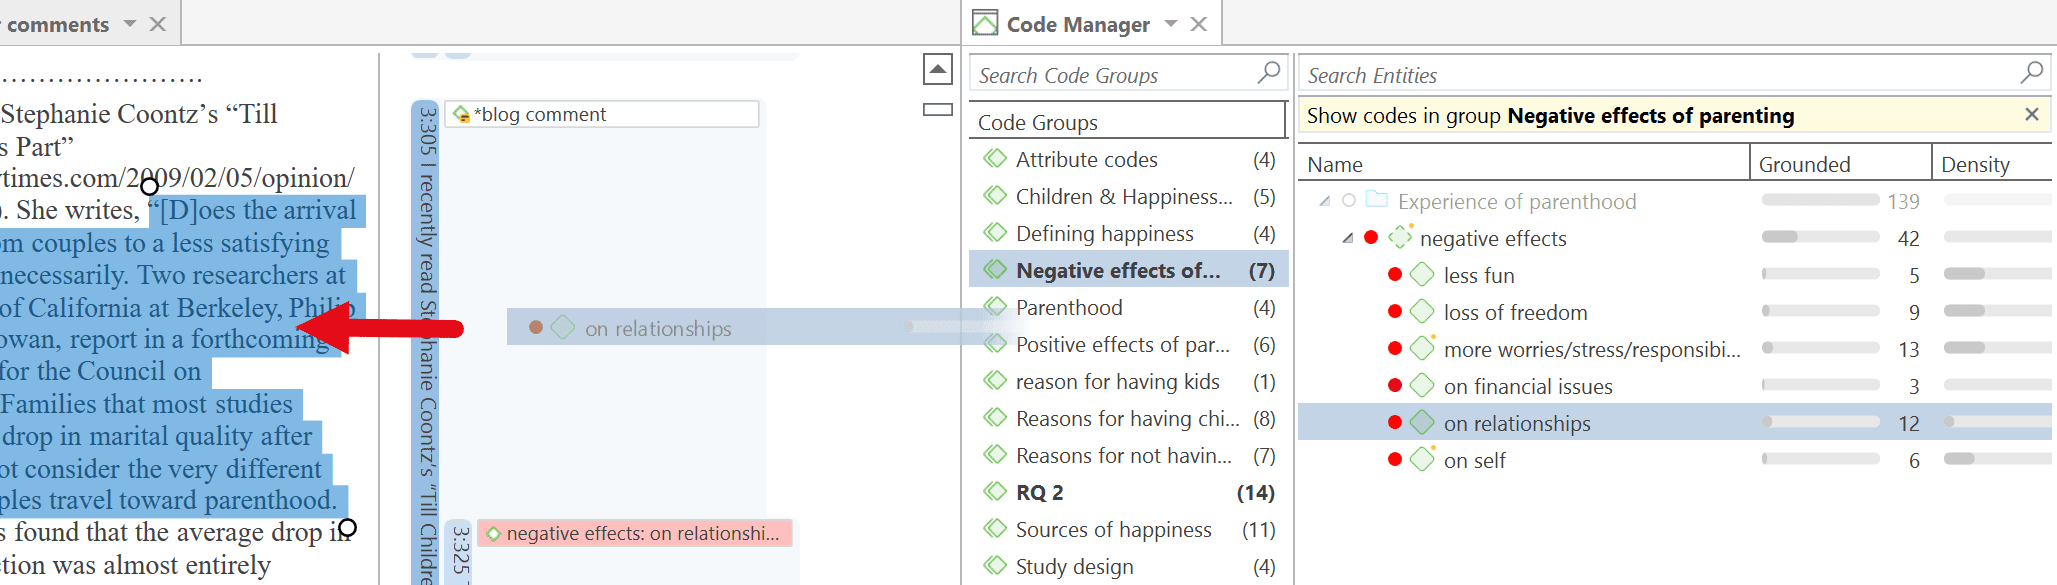
Perhaps you first read a transcript in Word and write initial coding ideas as comments in the margin. If you add this transcript to ATLAS.ti, all commented segments will already be marked as quotations.
Open the Quotation Manager alongside the document, so you can read the comments you wrote. Based on your comments you can begin with your coding work. Go through each quotation, open the coding tool and create new codes, or apply existing ones.
Another option is to prepare an Excel table based on the comments you wrote and import it as your initial code list. See Immporting a codebook.
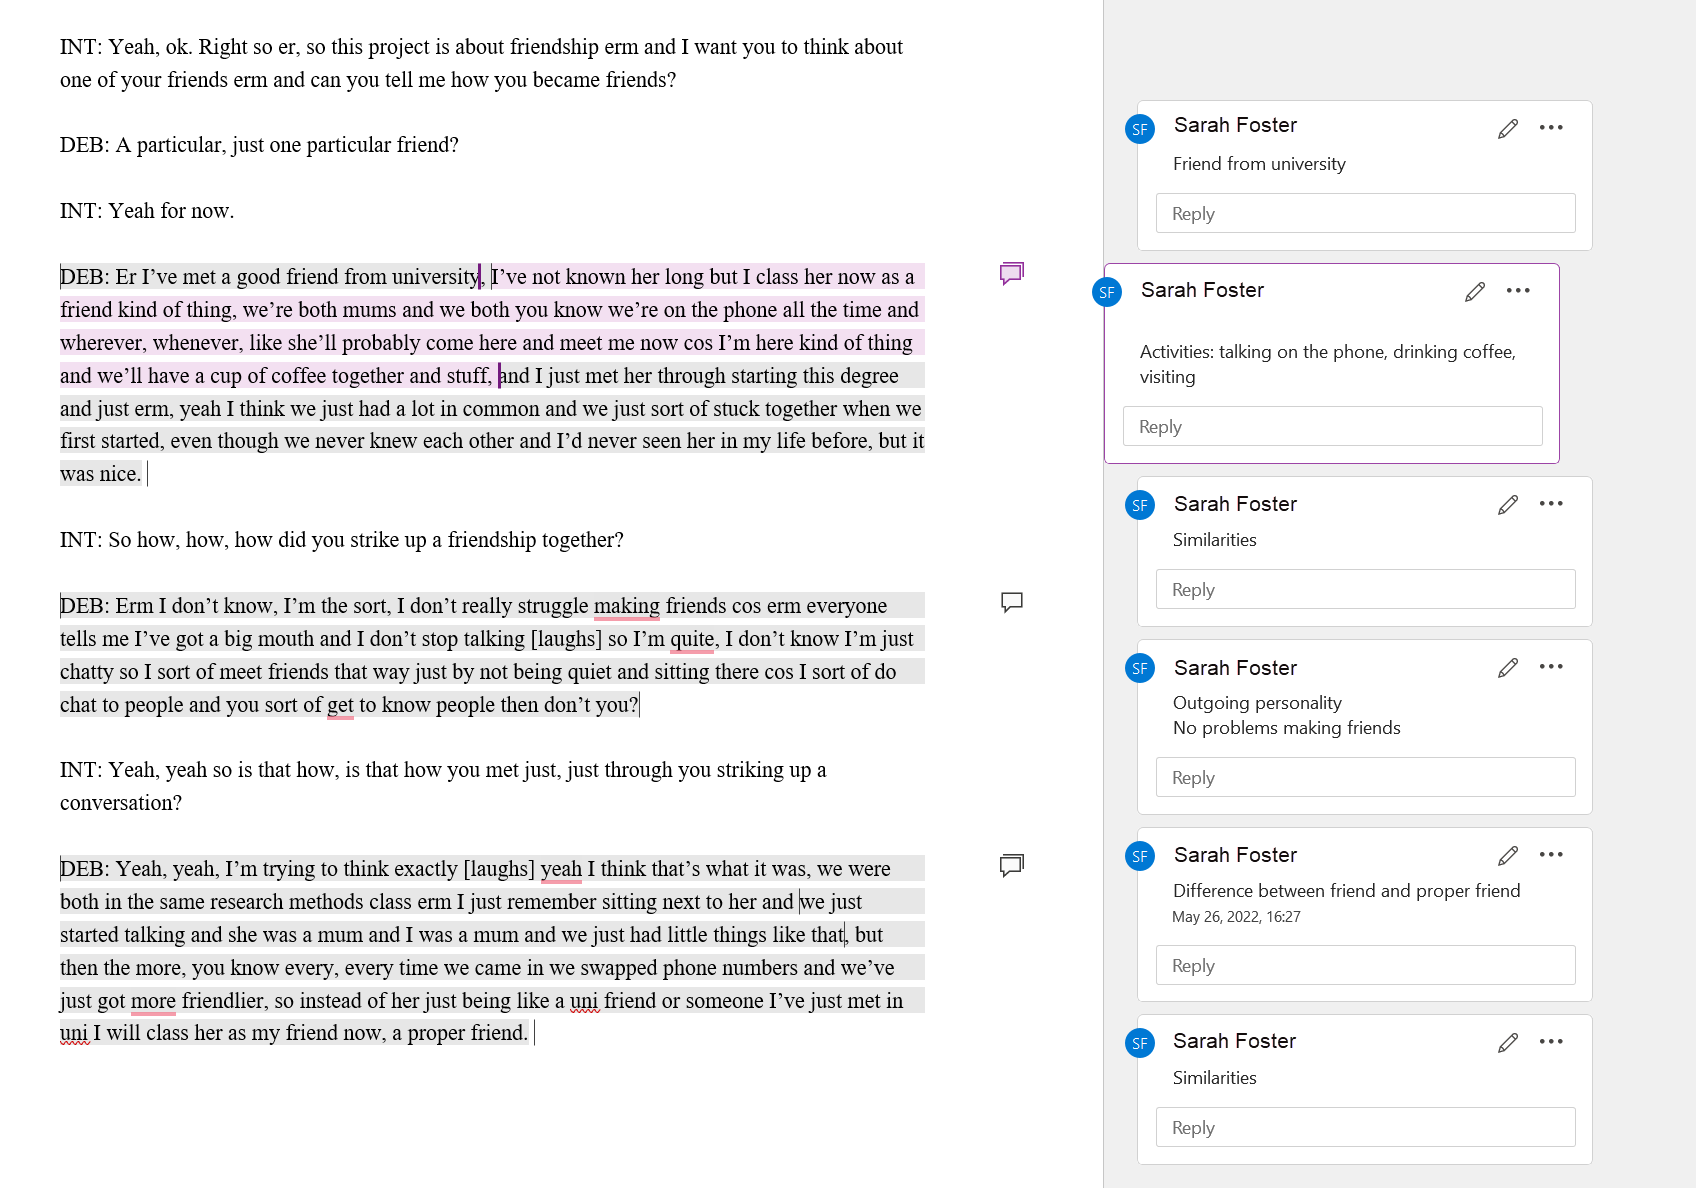
In the image below you see, how it looks like when this document is imported in ATLAS.ti:
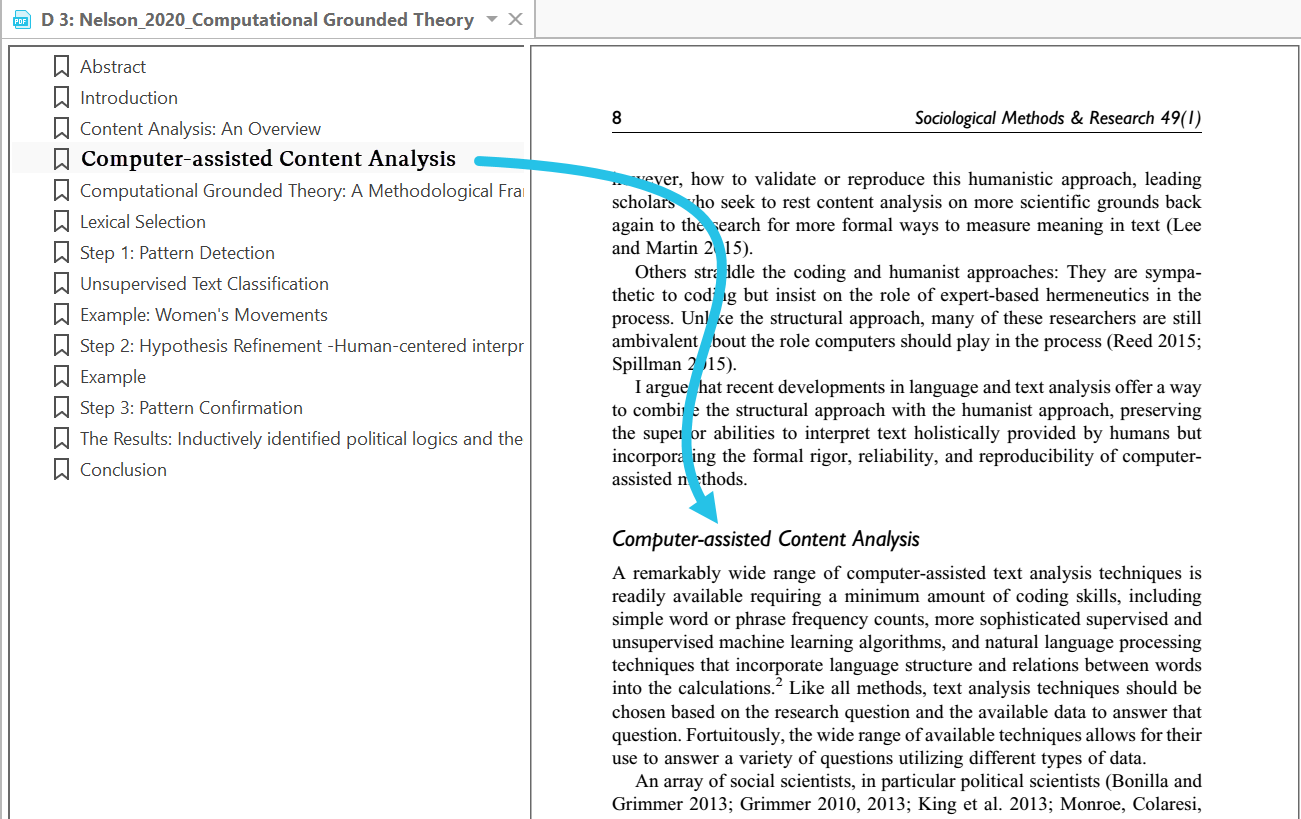
PDF files with bookmarks
If your PDF documents have bookmarks, you can also use them in ATLAS.ti.
Load a PDF document that has bookmarks.
In the contextual ribbon for Documents, click on View and activate Show Bookmarks:
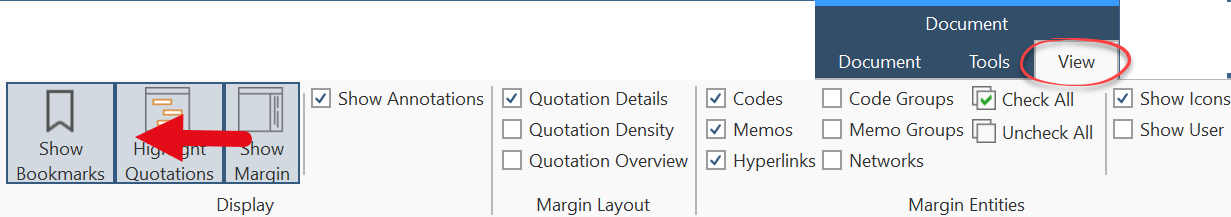
You can use the bookmarks to navigate through your PDF document:
PDF files (eBooks, PowerPoint, Spreadsheets, Visio, Draw)
The following file types will be transformed into PDF files, when adding them to an ATLAS.ti project:
- Ebooks (.mobi)
- Excel (.xls and .xlsx) and Libre Office Calc (.ods) spreadsheets
- Powerpoint (.ppt and .pptx)
- Libre Office Impress (.odp) presentations
- Visio (.vsd and .vsdx) and Libre Office Draw (.odg) documents
Images
Supported graphic file formats are: bmp, gif, jpeg, jpg, png, tif and tiff.
Size recommendation: Digital cameras and scanners often create images with a resolution that significantly exceeds the resolution of your screen. When preparing a graphic file for use with ATLAS.ti, use image-processing software to reduce the size so that the graphics are comfortably displayed on your computer screen. ATLAS.ti does resize the images if they are too big. But this requires additional computer resources and unnecessarily uses space on your computer hard disk.
To resize and image manually, you can use the zoom function via the mouse wheel or the zoom button in ATLAS.ti.
Audio- and Video Documents
Supported audio file formats are: aac, m4a, mp3, mp4, wav. Supported video file formats are; 3g2, 3gp, 3gp2, 3gpp, asf, avi, m4v, mov, mp4, wmv For audio files, our recommendation is to use *.mp3 files with AAC audio, and for video files *.mp4 file with AAC audio and H.264 video. These can be played both in the Windows and in the Mac version. More information is available here. As video files can be quite sizable, we recommend linking video files to an ATLAS.ti projects rather than to import them. See Adding Documents for further information.
Geo Documents
When you want to work with Geo data, you only need to add a new Geo Document to your ATLAS.ti project. This opens an Open Street world map. When you click on the option Query Address, you can navigate to a specific region or location on the map. For more information, see Working With Geo Docs.
Social Network Comments
ATLAS.ti imports Excel files generated by exportcomments.com. You can use the service for free to export up to 100 comments per link. For a small fee, you can use the service for three days to download the data you need. This also allows you to export nested comments.
Supported social networks are:
- YouTube
- TikTok
- VK
- Twitch
- Discord
For further information see Importing Social Network Data.
Survey Data
The survey import option allows you to import data via an Excel spreadsheet (.xls or .xlsx files). Its main purpose is to support the analysis of open-ended questions. However, this option can also be used for other case-based data that can easily be prepared in form of an Excel table.
In addition to the answers to open-ended questions, data attributes (variables) can also be imported. These will be turned into document groups in ATLAS.ti. For more information, see Working With Survey Data.
Reference Manager Data
In order to support doing a Literature Review with ATLAS.ti, you can import articles from reference managers. The requirement is that you are using a reference manager that can export data as Endnote XML file like Endnote, Mendeley, Zotero, or Reference Manager.
If your reference manager cannot export data in Endnote xml format, you can export data in RIS or BIB format and use the free version of Mendeley or Zotero to produce the xml output for ATLAS.ti.
See Working With Reference Manager Data.
You can collect data from Twitter searching for keywords, hashtags, users, etc. ATLAS.ti can collect tweets that are not older than one week !
You need to sign in with your own Twitter account to import twitter data to ATLAS.ti. See Working With Twitter Data.
Evernote
If you collect and store you data using Evernote, you can directly import files and folders from Evernote. See Bring out the best in Evernote with ATLAS.ti Windows.
Supported formats are:
| Evernote Export | File Type |
|---|---|
| Evernote 2.x database | .enb |
| Evernote exported XML data | .enex |
| Evernote database | .exb |
| Evernote data | .reco |
| Evernote handwritten notes and sketches | .top |
| Evernote for Google Android note file | .enml |
Adding Documents
Video Tutorial: Creating a project and adding data.
What happens when you add documents to a project
All documents that you add to a project are copied, and the copies become internal ATLAS.ti files. This means, strictly speaking, that ATLAS.ti no longer needs the original files. However, we strongly recommend that you keep a backup copy of your original source files.
When you add documents to a project, they are stamped with a unique ID. This ID allows ATLAS.ti to detect if documents are the same when merging different projects.
What happens when you add documents to a project
All documents that you add to a project are copied, and the copies become internal ATLAS.ti files. This means, strictly speaking, that ATLAS.ti no longer needs the original files. However, we strongly recommend that you keep a backup copy of your original source files.
As audio and video files can be quite sizable, you have the option to create an external reference to the files. This means the multimedia documents remain at their original location and are accessed from there. Preferably, these files should not be moved to a different location. If the files need to be moved, you need to re-link the files to your project. ATLAS.ti will alert you, if there is an issue, and a file can no longer be accessed.
Important for team projects
When you work in a team and want to work on the same documents, it is important that one person is setting up the project and adds all documents and codes that should be shared. The reason for this is that all all entities are stamped with a unique ID when they are created. This ID allows ATLAS.ti to detect if entities are the same when merging projects.
If the same documents (or codes) are added on different computers to different projects, then they all have different IDs. Rather than being merged when you merge all projects, they are added. Thus, the merged project contains duplicates. You can merge duplicated codes yourself, but you cannot merge duplicated documents! If this happens, you need to manually transfer all coding that has been done from the duplicated documents. See Team Work for further information.
How to add documents
Click on the Add Documents button in the Home tab, click on the drop-down arrow, or drag- and-drop them from the Windows Explorer either onto the document display area or the ribbon.
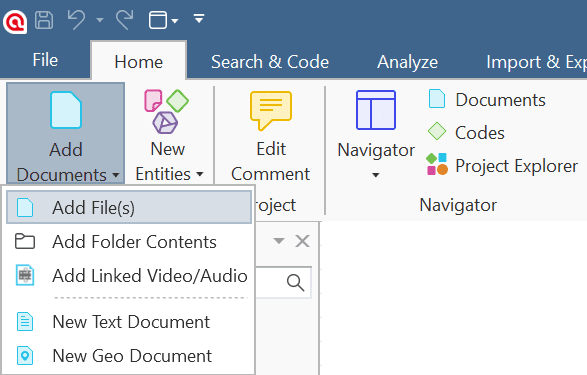
Click on "Add Documents" to select individual files. If you want to add entire folders or link larger multimedia files (audio / video) to your project, click on the dialog box launcher and select the appropriate option.
All added or linked documents are numbered consecutively starting with D1, D2, D3 and so on.
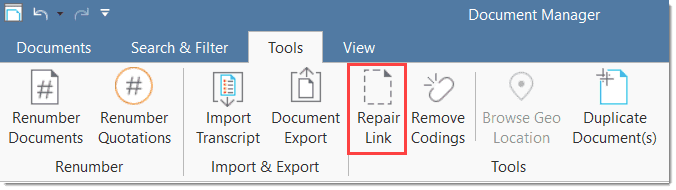
Linking video files
As video files can be quite sizable, you have the option to link them to a project instead of adding them. This means they remain at their original location and are accessed from there. Preferably, these files should not be moved to a different location.
If the files need to be moved, you need to re-link the files to your project. ATLAS.ti will alert you, if there is an issue, and a file can no longer be accessed. You find a Repair Link option in the Document Manager under the Document Manager > Tools Tab.
You can of course also import iranscripts; see Importing Transcripts. Or prepare your own transcripts.
Sort Order of Documents
The default sort order is by name in alphabetical order. You cannot change the order of the documents by dragging them to a different position. However, it is possible to change the order of the documents by renaming and then renumbering them. See User-defined document sort order.
Size Restrictions
Theoretically, size restrictions do not play a major role due to the way ATLAS.ti handles documents. However, you should bear in mind that your computer's processing speed and storage capacity may affect the performance.
Excessively large documents can be uncomfortable to work with, even when you have an excellently equipped computer.
For textual documents, the number and size of embedded objects may cause extraordinarily long load times. There is a high likelihood that if a textual document loads slowly in ATLAS.ti, it would also load slowly in Word or WordPad.
For very long texts or multimedia files, scrolling to exact positions can be cumbersome.
Please keep those issues in mind when preparing your files.
A Word about "Big Data"
Please keep in mind that the focus of ATLAS.ti is to support qualitative data analysis and to a lesser extent the analysis of qualitative data.
Big data is a buzz word nowadays, and a lot of big data often comes as text or images, hence could be considered qualitative. ATLAS.ti, however, is not suited for true big data analysis, which is not the same as qualitative data analysis.
As point of orientation, coding can be supported using the auto coding feature. However, you still need to read and correct the coding, and most coding in ATLAS.ti is done while the researcher reads the data and creates or selects and applies a code that fits.
A project is too large if you have so much data that you need to rely on a machine to do all the coding for you, and you cannot read what has been coded yourself. While we are adding natural language processing tools to ATLAS.ti as well as continuously improving performance for large projects, these tools are designed to help you as a researcher, not replace the human. While it may sometimes seem otherwise, computers still can't think.
Importing an Existing Project
The following project types can be imported:
| Version | File Type |
|---|---|
| Version 22 | Project Bundle |
| ATLAS.ti Web | Project Bundle |
| Version 9 | Project Bundle |
| Version 8 | Project bundle |
| Version 7 | Transfer bundle or copy bundle |
| Version 6 and older | Copy bundle |
Project Exchange format | QDPX
Exported projects from the Ipad or Android apps can also be imported. ATLAS.ti Cloud projects can currently not be imported into the desktop version.
How to Import Projects
If you just started ATLAS.ti,
Select the Import Project option on the right-hand side of the opening screen.
If ATLAS.ti is already open,
Select File > New and from there the Import Project option.
Options
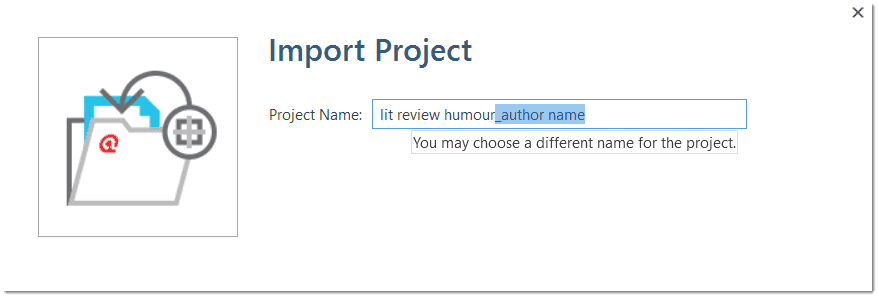
- You have the option to rename the project before importing. This is useful for team project work and if you do not want to overwrite an existing version.
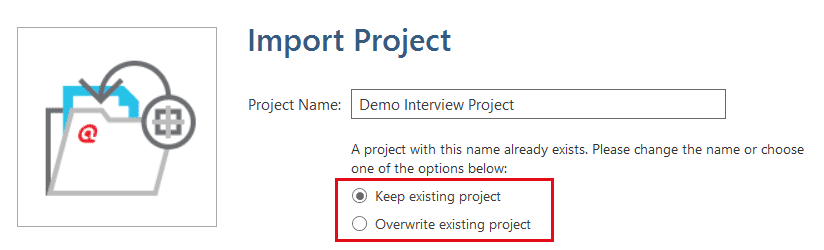
- If the project that you are importing already exists in your library, you have the choice to either overwrite the existing project with the version you are importing, or whether you want to rename the project that you are importing.
If the project contains Linked Media Files
If the project contains linked media files, and the files have not been included in the bundle, you can relink them. This requires that you have a copy of the file on your computer, or a file that is accessible on an external drive or server.
In the example shown below, the source for document 23 is a video that is available in the library. The source for document 26 is a linked video and needs to be relinked in order for it to be displayed in ATLAS.ti:
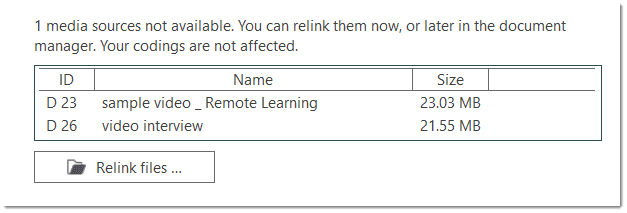
You can also decide not to relink the files at this stage and proceed with importing the files. The linked multimedia documents are still listed under Documents, but you cannot load them. They will appear gray in the Document Manager.
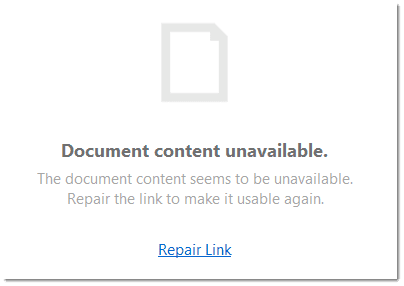
If you double-click on a multimedia file that is not available, ATLAS.ti gives you the option to repair the link. This means, you point ATLAS.ti to the folder where the multimedia file is stored, so that it can be relinked to your project.
Creating a Project Backup
ATLAS.ti 22 projects cannot be used in previous versions.
Please export your projects on a regular basis and store the bundle files in a safe location. In case something happens to your computer, you still have a copy of your project to fall back on!
To create a backup of your project, you need to export it and save it as project bundle file on your computer, an external drive, a server or cloud location.
A project bundle file serves as external backup of your project independent of the ATLAS.ti installation on your computer.
-
The project bundle file contains all documents that you have added or linked to a project, and the project file that contains all of your coding, the codes, all memos,comments, networks and links. Large audio or video files can be excluded from the bundle.
-
Project bundle files are also used to transfer projects between computers. They can be read by both ATLAS.ti Mac and Windows. See Project Transfer.
-
If your project contains linked documents, they can be excluded when creating a project bundle file. See "Creating Partial Bundles" below.
Exporting a Project
To export your project to either save it as backup or to use it for transferring it to a different computer:
Select File > Export.
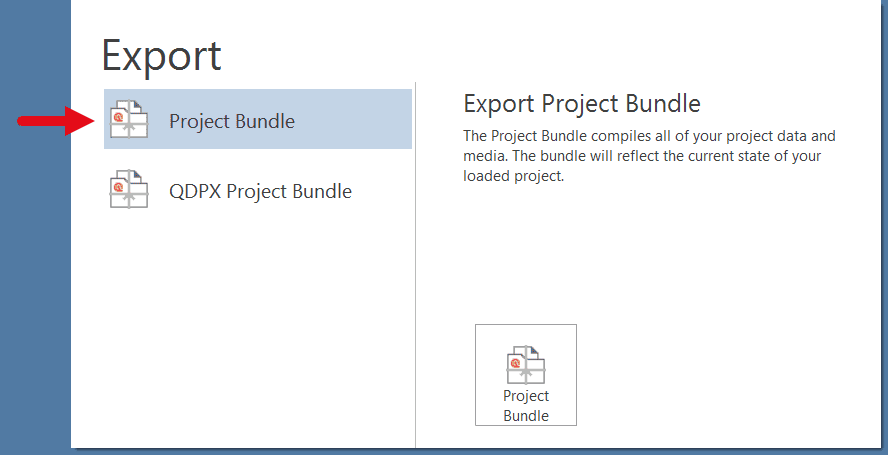
Click on the Project Bundle button.
If your project does not contain multimedia files, the Windows File Manager opens. If it does contain multimedia files, see Exporting partial bundle files.
The default name for the bundle will be the project name plus the name of the currently logged-in user and the date: project name (user name YYYY-MM-DD). You can rename the project bundle file at this stage, which however does not change the name of the project that is contained within the bundle.
Select a name and location where you want to store the project and select Save.
Think of the project bundle file like a bag that contains your project. Putting a different label on the outside of the bag does not change anything that is inside, which is your project with all your coded segments, comments, memos, networks, etc. and all documents that have been added to it. When you import the project bundle, the project name after import will still be the original name. If you want to rename the project file, you need to do this either during the process of importing the project, or on the opening screen. See Project Management.

Working With Groups
Groups in ATLAS.ti help you to sort, organize and filter the various entities. Groups are available for documents, codes, memos, and networks.
Common to all groups are:
- An entity can be sorted into multiple groups. For example if you sort a document into the group gender::female, it can also be sorted into other groups like location::urban, or family status::single.
- If you click on a group in a manager, you activate a filter (see below). Then only the items that are in the selected groups are displayed.
- You can combine groups using Boolean operators. See for example Exploring Coded Data.
- You can save a combination of groups for further re-use in form of a smart group.
- You can set groups as global filter.
There are no groups for quotations, as codes already fulfil this function. Codes group quotations that have a similar meaning. Therefore instead of groups, you see the codes in the side panel of the Quotation Manager.
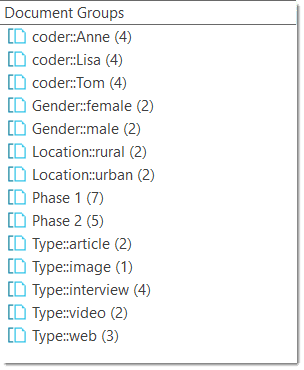
Application of Docume
Video Tutorial: Organizing documents and document groups. Often data come from different sources, locations, respondents with various demographic backgrounds etc. To facilitate the handling of the different types of data, or to compare respondents based on sociodemographic characteristics, they can be organized into document groups. You can also use document groups for administrative purposes in team projects if different coders should code different documents. You can then create a group containing all documents for coder 1, another group containing the documents for coder 2 and so on.
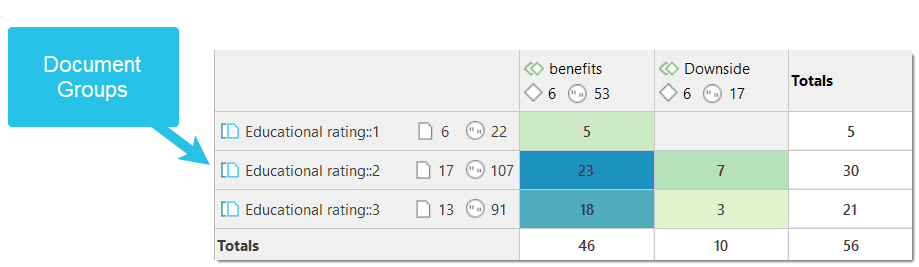
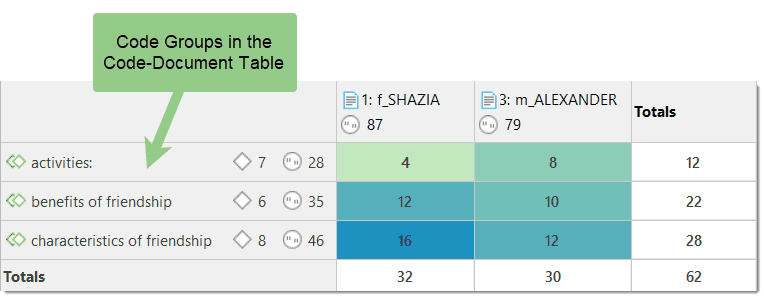
 Another application is the use of document groups for analytic comparisons in the Code Document Table.
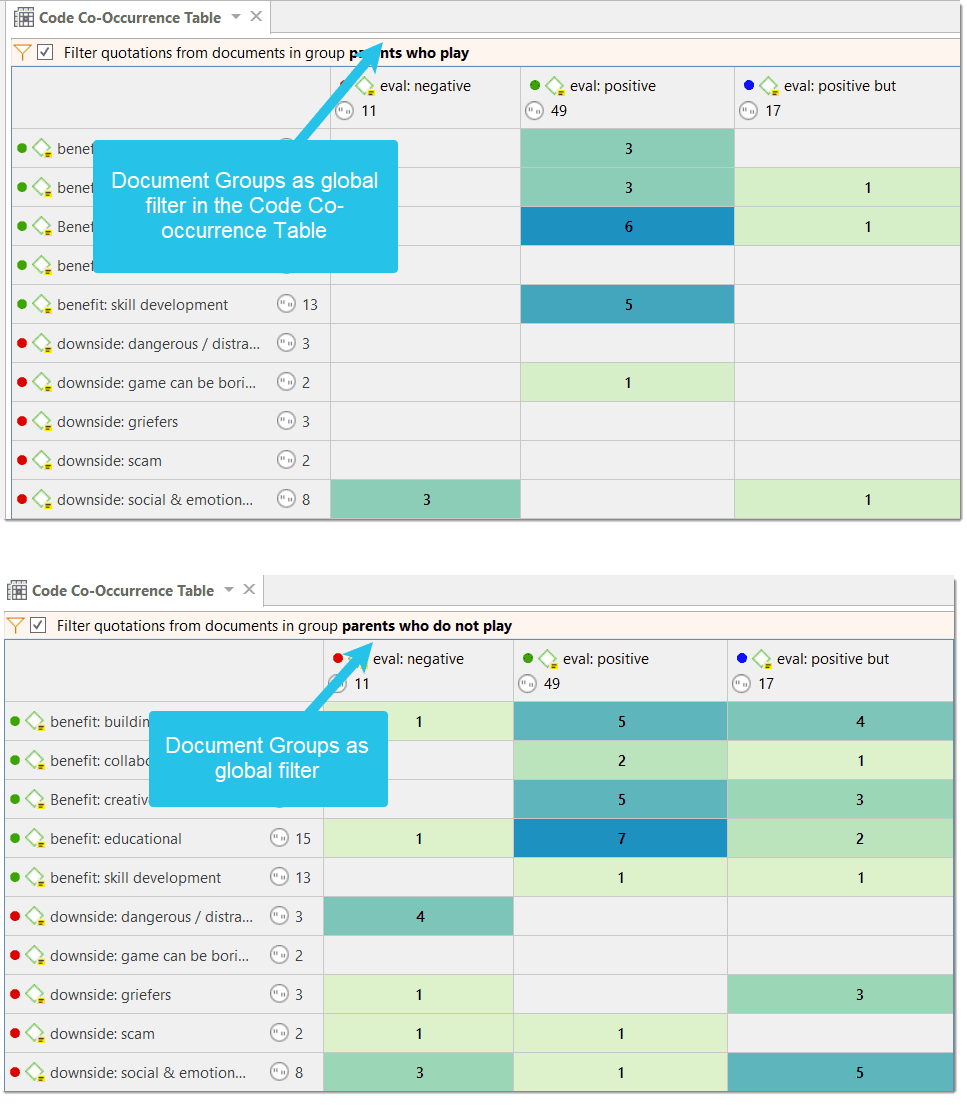
 Document Groups are also useful as global filters for instance for Code Co-occurrence Analysis.
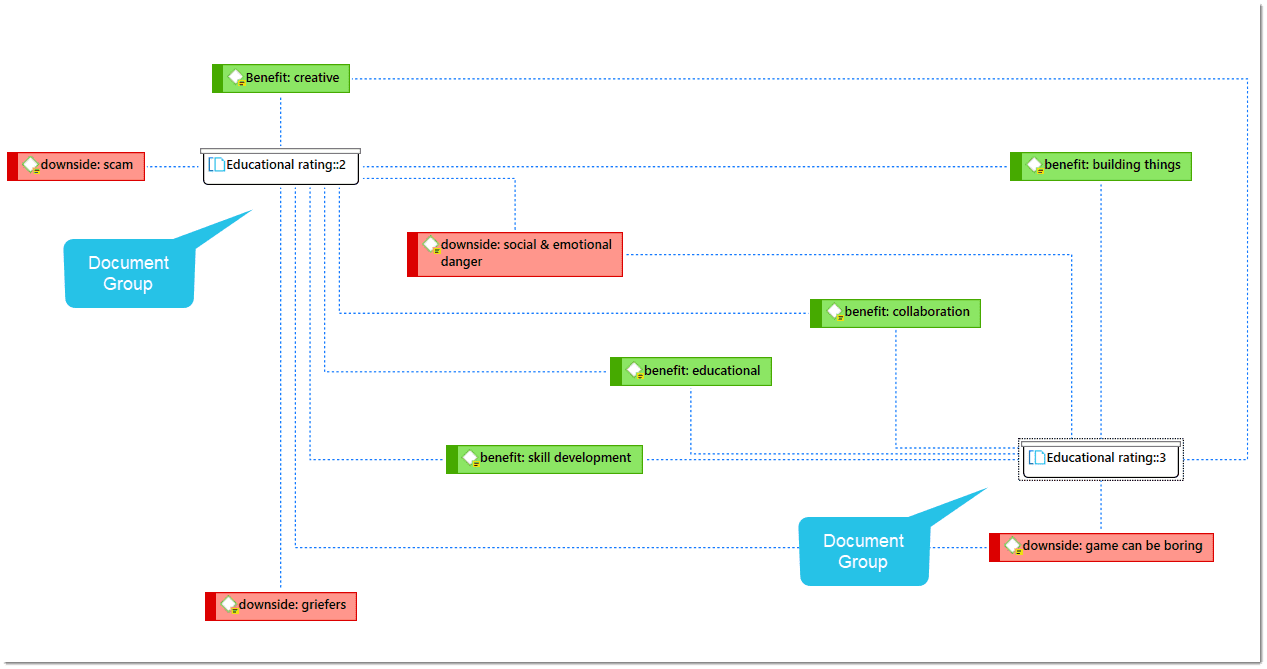
Document groups can also be added to Networks and you can show which codes have been applied to which group.
Application of Code Groups
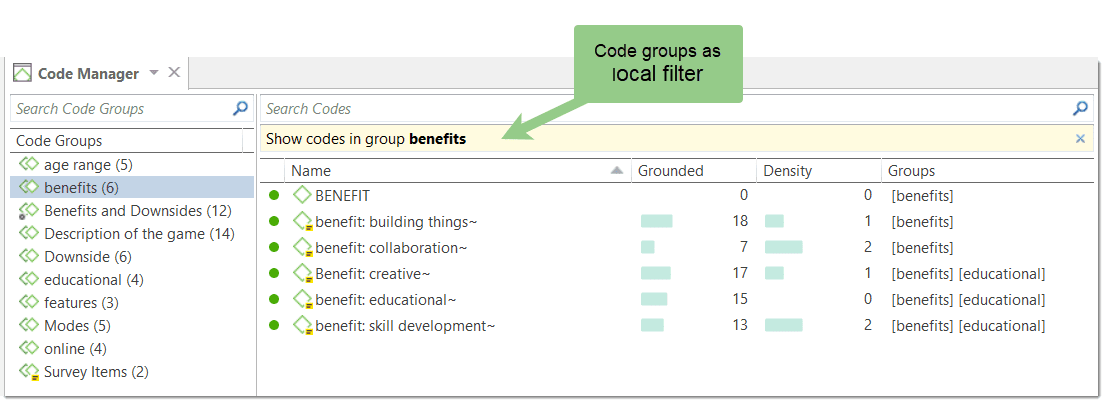
Code groups can be used to sort and organize codes in the Code Manager. Code groups facilitate the navigation of codes in the Code Manager as local filter.
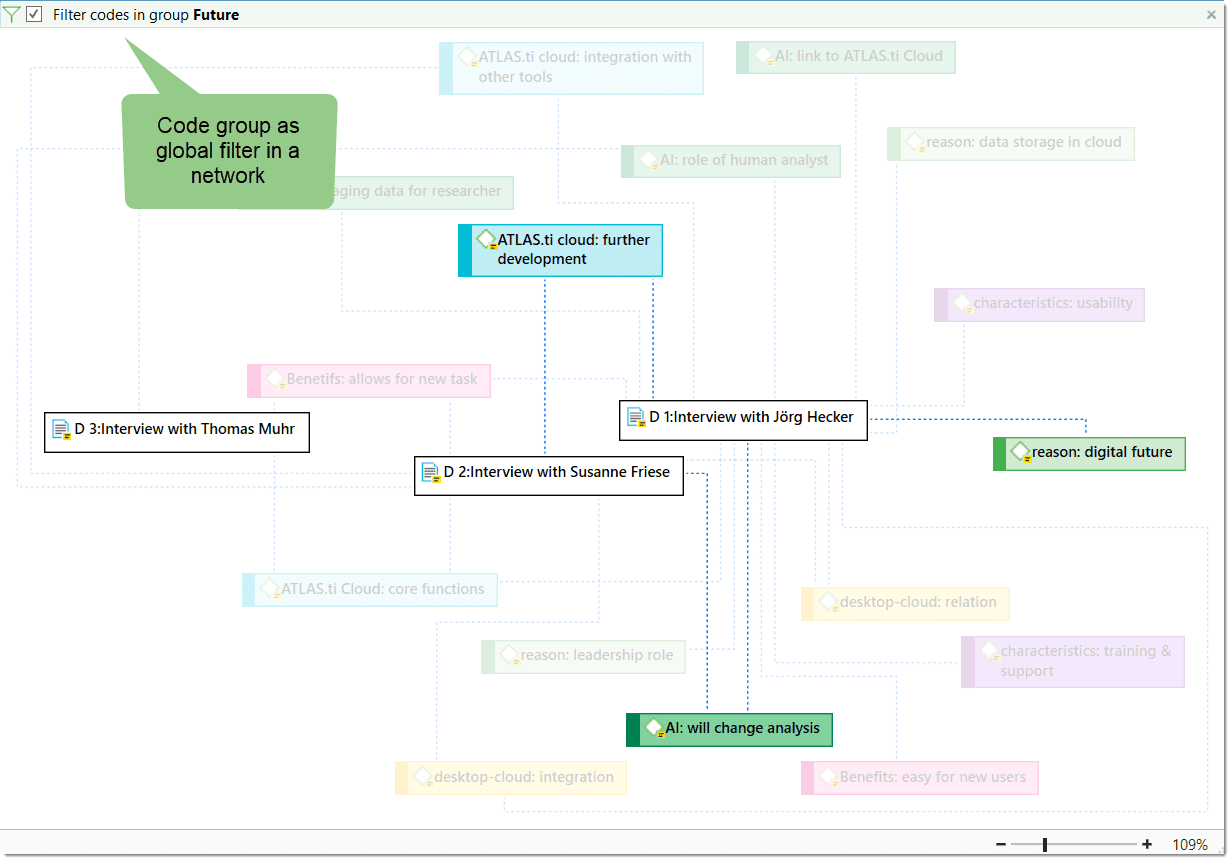
 Code groups can be used as global filters in analysis.
Code groups can also be used in the Code Document Table for case comparisons.
Users often mistake code groups as a kind of higher order code, which they are not. They do however can be quite useful in building a coding system.
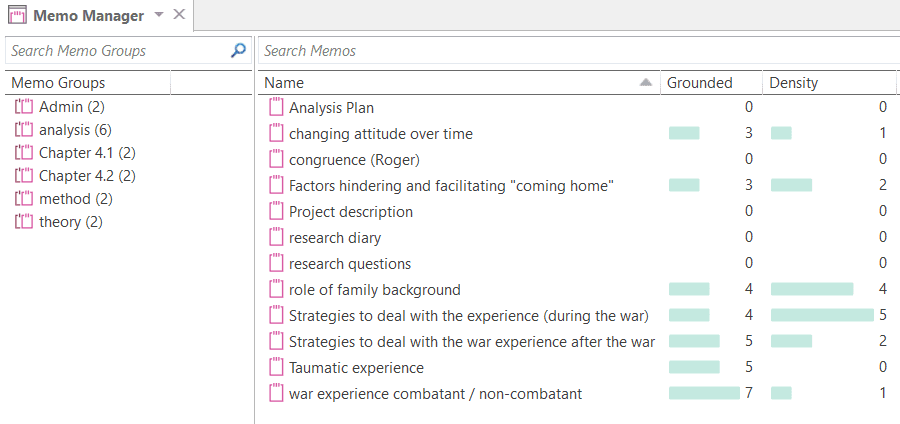
Application of Memo Groups
Memo groups come in handy if you have written lots of memos. You could for example group memos by function: methodological notes, team memos, research diaries, analysis.
If you have multiple memos that contain answers to one research question, you can group all those memos.
If you have multiple memos that contain input for a particular section in the research report, you may want to create a memo group for those.
You find more information on working with memos here: Memos and Comments.
Groups as Filters
Groups are listed in the filter area of the document, code, memo and network manager.
Click on one or more groups to filter the list of items. If you want to select multiple groups hold down the Ctrl key.
Once you have set one or more groups as filter, a yellow bar appears above the entity list indicated that a) a filter has been set, and b) which one.
To reset the filter to see all entities again, click the X on the top right-hand side of the yellow bar.
It is also possible to run simple AND and OR queries:
As soon as you select more than one group, you see the word any in blue in the filter bar. This means the default operation is to combine the items of the selected groups with OR.
If you want to filter by the intersection of two or more groups, click on the word "any" and change it to all. This is the Boolean AND operator.
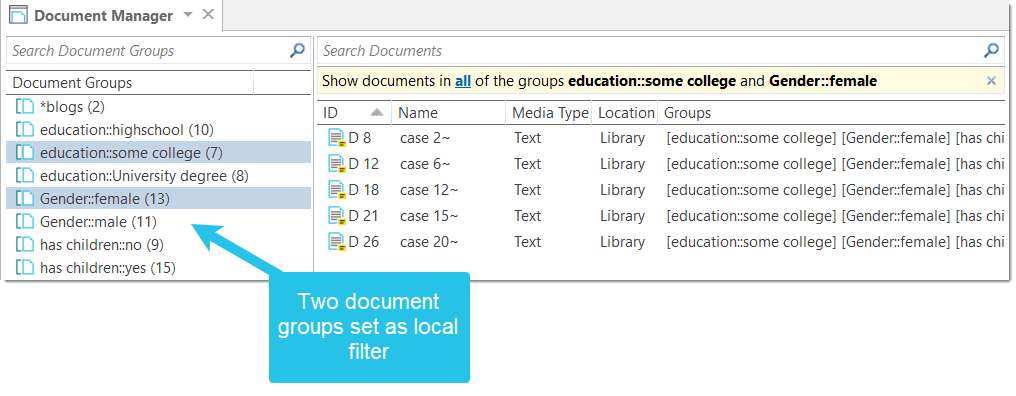
An example would be to filter by all female respondents who live in an urban region. This requires that you have grouped the documents by these two criteria:
- education::some college
- Gender::female The same options are available for all entity types.
Working with Quotations
Video Tutorial: Working with quotations. Christine Silver, expert in Computer Assisted Qualitative Data Analysis Software, explains the ATLAS.ti quotation level as follows:
"When you create a quotation, you’re marking a segment of data that can later be retrieved and reviewed. You might know, right at that point how and why it’s interesting or meaningful, in which case you can immediately capture that – by re-naming it, commenting on it, coding it, linking it to e.g. another quotation, or a memo. If you don’t yet know, you can just create the quotation, and come back and think about it later, perhaps when you have a better overview of the data set in its entirety and are ready to conceptualise meaning in relation to your research objectives."
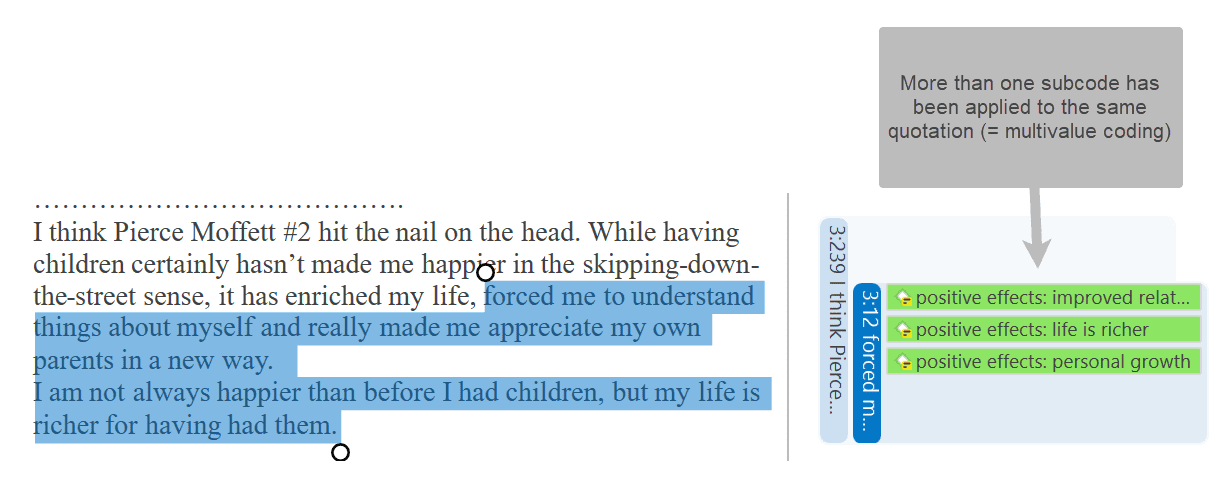
"One of my favourite things about ATLAS.ti is that quotations can be visualised and worked with in a graphical window, i.e., the ATLAS.ti networks. The content of quotations can be seen within the network, and quotations can be linked, commented upon, and coded in that visual space. This is very useful if you like to work visually or are used to analysing qualitative data manually with highlighters, white-boards, post-it notes etc. Networks can also be used as visual interrogation spaces – for example to review quotations which have more than one code attached, which is very powerful. Everything you do in the network is connected throughout the ATLAS.ti project."
The ATLAS.ti Quotation Level
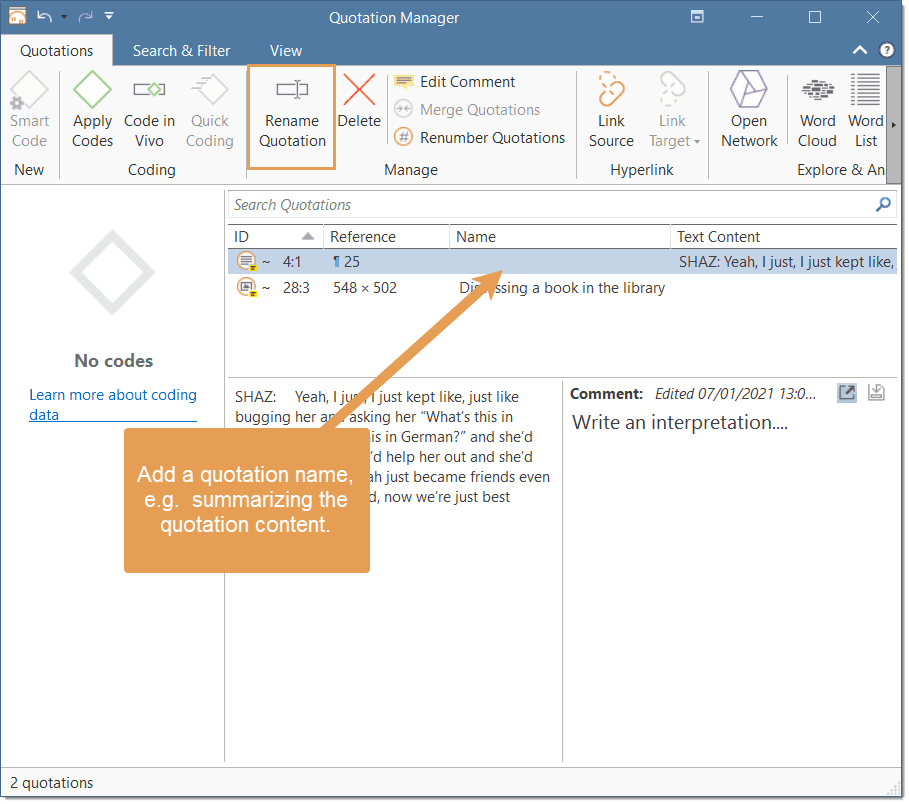
The ATLAS.ti quotation level gives an extra layer of analysis. In ATLAS.ti you are not required to immediately code your data as in most other QDA software. You can first go through your data and set quotations, summarize the quotations in the quotation name and write an interpretation in the comment field. This is useful for many interpretive analysis approach for the process of developing concepts. Once you have ideas for concepts you can begin to code your idea. This also prevents you from falling into the coding trap, i.e. generating too many codes. Codes that can be applied to only one or two segments in your data are not very useful. Code names should be sufficiently abstract so that you can apply them to more than just a few quotations.
Creating Quotations in Text Documents
When you code data, quotations are created automatically. See Coding Data.You can however also create quotations without coding. To do so:
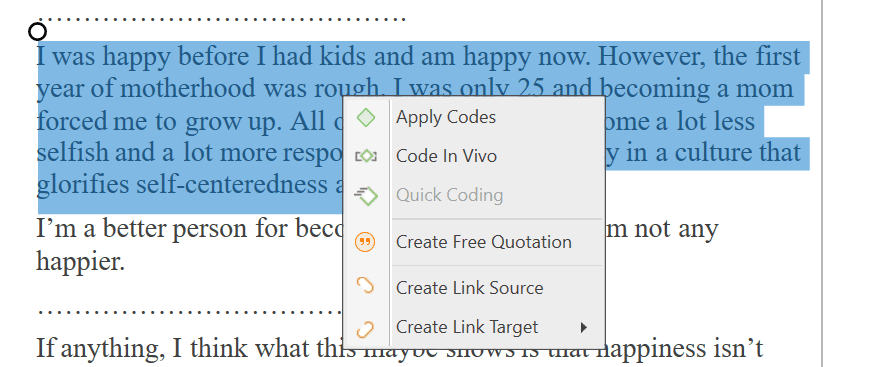
Highlight a section in your text, right click and select the option Create Free Quotation. Alternatively, you can also select the equivalent button in the ribbon.
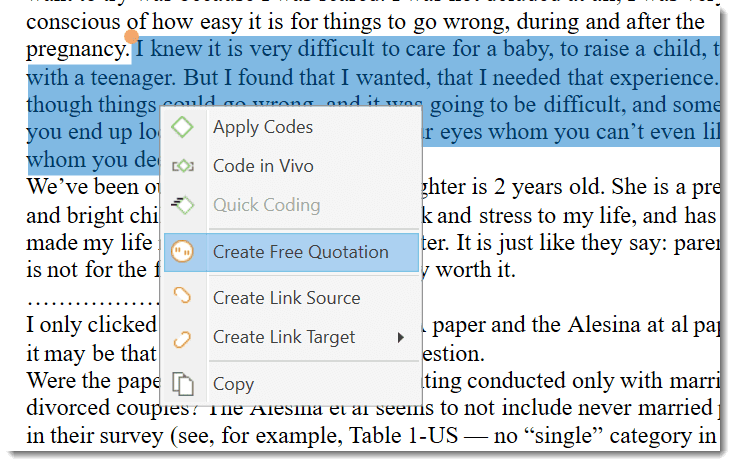
Once a quotation is created, you see a blue bar in the margin area and an entry in the Quotation Manager and the Document tree in the Project Explorer.

Quotation ID
Each quotation has an ID, which consists of two numbers:
- The ID 8:1 means that the quotation was created in document 8, and it is the first quotation that was created in this document.
- The ID 3:10 means that the quotation was created in document 3, and it is the 10th quotation that was created in this document.
Quotations are numbered in chronological and not in sequential order. If you want to change this order, see the next section:
Changing the Chronological Order of Quotations
The quotation ID numbers quotations in the chronological order when they have been created. For various reasons, at times users want the quotations to be numbered in the sequential order as they occur in the document.
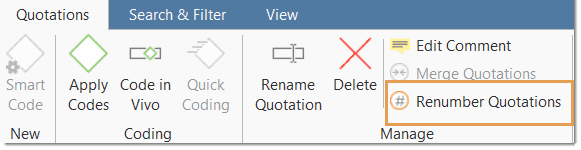
When you delete quotations, the numbering is not automatically adjusted. Instead, they are gaps. Renumbering the quotations also closes those gaps.
To renumber quotations:
Open the Quotation Manager and select the Renumber Quotations option in the ribbon.
Adding Quotation Names
Being able to name each quotation has a number of useful app
- It allows you to quickly glance through your quotations in list view.
- You can use the name field to paraphrase a quotation as required by some content analysis approaches, or to write a short summary.
- You can use the name field for fine-grained coding (line-by-line Grounded Theory coding; initial coding in Constructive Grounded Theory, or as required by other interpretative approaches) instead of applying codes. If you already apply codes during this phase, you will end up with too many codes that are useless for further analysis. See Building a Code System.
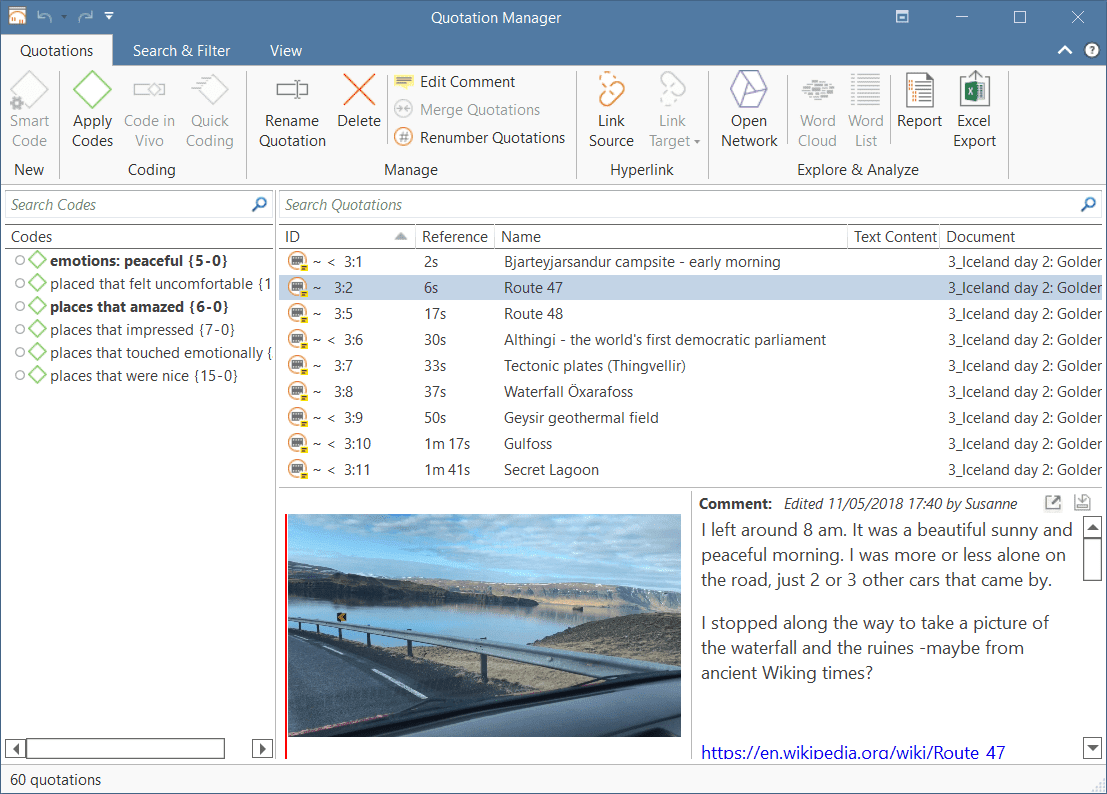
- Adding titles to multimedia quotations. See Working with Multimedia Data.
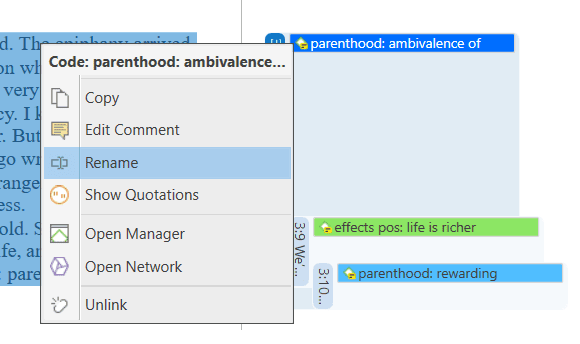
To add a name to a quotation, right-click on a quotation in the margin area, the Project Explorer, the Quotation Manager or in the Quotation Reader and select Rename.
The example below shows an example where a name was added to add titles for video quotations:
tip
If you select a quotation in the Quotation Manager, you see a preview of the quotation in the panel below the quotation list. This applies to all data file formats.
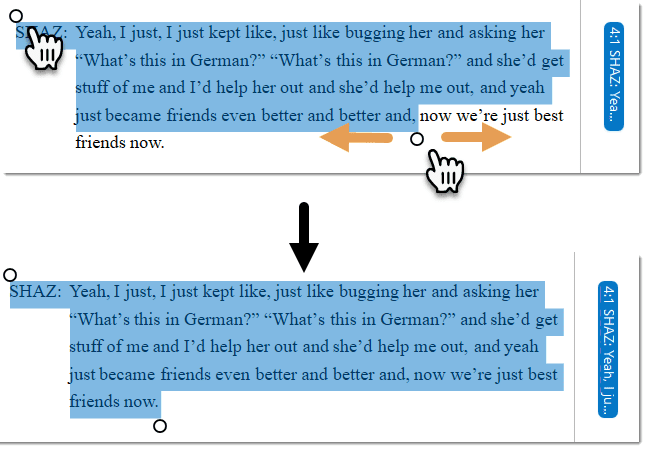
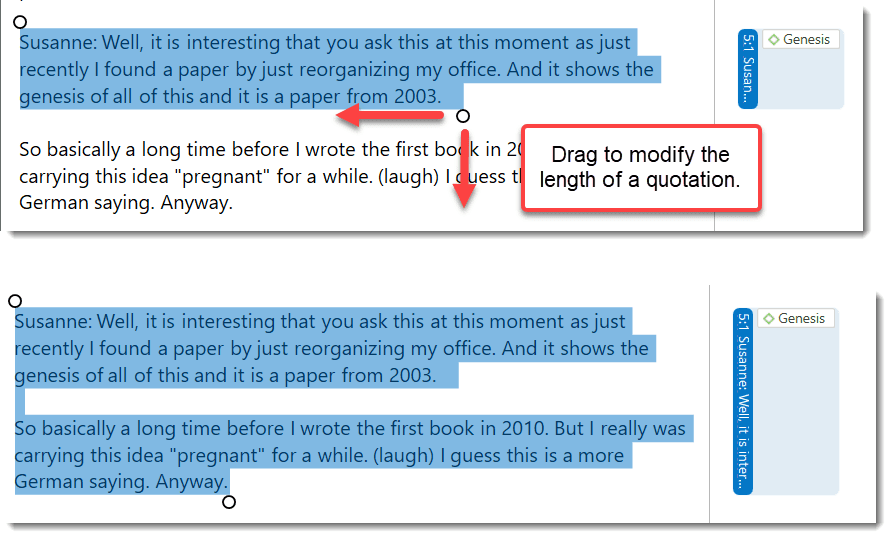
Resizing a Quotation
Modifying the length of a quotation is easy.
If you select a quotation, e.g. by clicking on the bar in the margin area, you see an orange dot at the beginning and at the end of the quotation. Move the start or end position to a different location depending on whether you want to shorten or lengthen the quotation. This applies to all media types.
Coding Data - Basic Concepts
“Coding means that we attach labels to 'segments of data' that depict what each segment is about. Through coding, we raise analytic questions about our data from […]. Coding distills data, sorts them, and gives us an analytic handle for making comparisons with other segments of data” (Charmaz, 2014:4).
“Coding is the strategy that moves data from diffuse and messy text to organized ideas about what is going on” (Richards and Morse, 2013:167).
"Coding is a core function in ATLAS.ti that lets you “tell” the software where the interesting things are in your data. ... the main goal of categorizing your data is to tag things to define or organize them. In the process of categorization, we compare data segments and look for similarities. All similar elements can be grouped under the same name. By naming something, we conceptualize and frame it at the same time" (Friese, 2019).
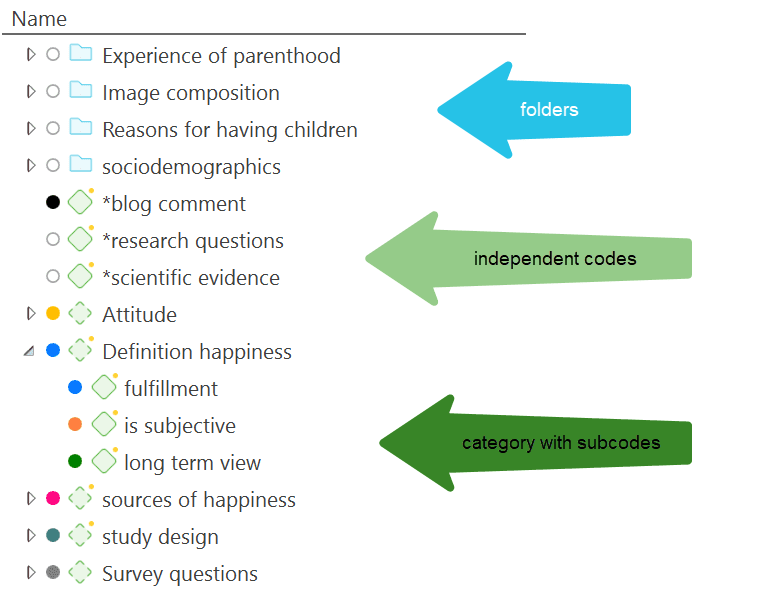
Independent Code / Category Code / Subcode
ATLAS.ti 22 offers you new ways to organize your codes in the code system. If you do not have the need to organize your code into a hierarchy of higher and lower order codes, you can work with independent codes. If you want to create a hierarchy of codes, you can make use of category codes and subcodes. If some codes do not fit in any category, they can just remain independent codes.
An additional way to organize your codes are folders. You can add independent codes and categories with their subcodes to folders. Folders can also contain other folders.
 Below each of these types are explained in more detail:
Independent code: If you start coding your data, and you begin with creating some new codes, those will be independent first level codes. They remain independent codes until you add them to a category as subcode. The groundedness of an independent code is the number of quotations coded by it.
Free code: A free code is also an independent code, but one that has not (yet) been used for coding. Its groundedness is zero and it has no subcodes.
Category Code: A code becomes a category, when you drag & drop codes underneath it. These can be independent codes or subcodes that you move from a different category. The category itself does not code quotations. Therefore, you can only insert other codes as subcodes underneath if the code is not linked to quotations.
The reason for this is that via the category code you can retrieve all quotations from all sub codes. So, if you want an aggregated view of your data, just select the category. If you could apply the category code and its subcodes to the same quotations, you would get duplicated quotations. This is prevented by not allowing the category code to be used for coding.
The groundedness of a category code is the number of quotations coded by all of its subcodes. Since you can apply several codes to the same quotation, the total for a category can differ from simply adding up quotations for all subcodes. Both sums are only equal, if you use subcodes in a mutual exclusive manner, as for example required for inter-code agreement analysis
For all previous ATLAS.ti users, because the category code can retrieve all quotations from its subcodes, the semantic operators SUB, UP and SIBLING are no longer needed and have been removed from the query tool.
Subcode: A subcode is a code that is sorted under a category code. No further subcodes can be created under subcodes. The reason for this is methodical rather than technical. Each code should only appear once in a code system. See: How to build a code system. If you use a deeper hierarchy, you will likely start duplicating and even multiplying codes at the lower levels. Not only does this make your code system long and difficult to maintain, it also prevents you from performing effective comparative analysis.
Folder: Folders help you organize your codes. You can move independent codes and categories with their subcodes into folders. A folder can also contain folders, as many as you want. Folders cannot be used to code data.
The number behind a folder, is the number of quotations coded by independent codes or sub codes that are contained within the folder. As you can apply multiple codes to the same quotation (i.e., multi-value coding), the total can be different from adding up all the numbers for all independent and all subcodes.
How Groundedness is Counted
 Independent Code: The groundedness of an independent code is the number of quotations coded by it.
Category Code: The groundedness of a category code is the number of quotations coded by all of its subcodes. Since you can apply several codes to the same quotation, the total for a category can differ from simply adding up quotations for all subcode. Both sums are only equal, if you use subcodes in a mutual exclusive manner, as for example required for inter-code agreement analysis
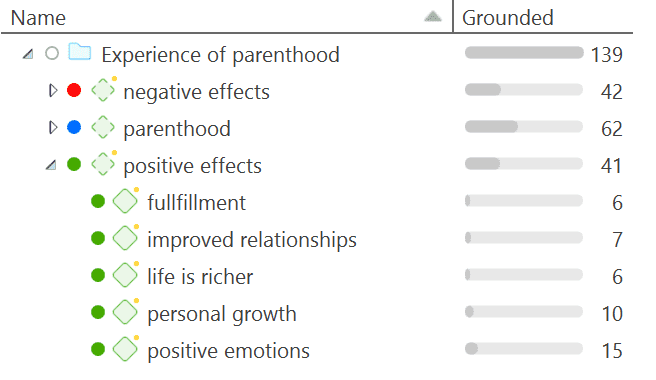
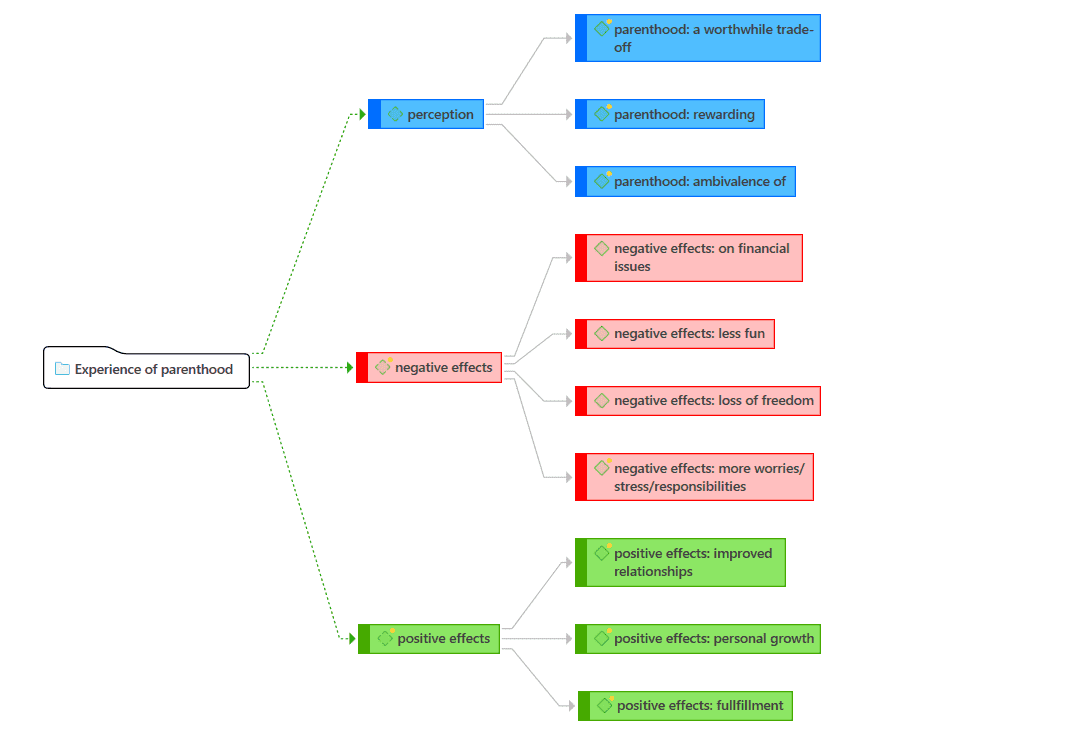
The image above shows the category positive effects. Adding up the quotations coded by all subcodes, the sum is 44. The groundedness for the category however is 41. This means there are 3 quotations that are coded with more than one of the subcodes. This is illustrated in the image below:
 Subcode: The groundedness of a subcode is the number of quotations coded by it. For example, the subcode life is richer is coding 6 quotations.
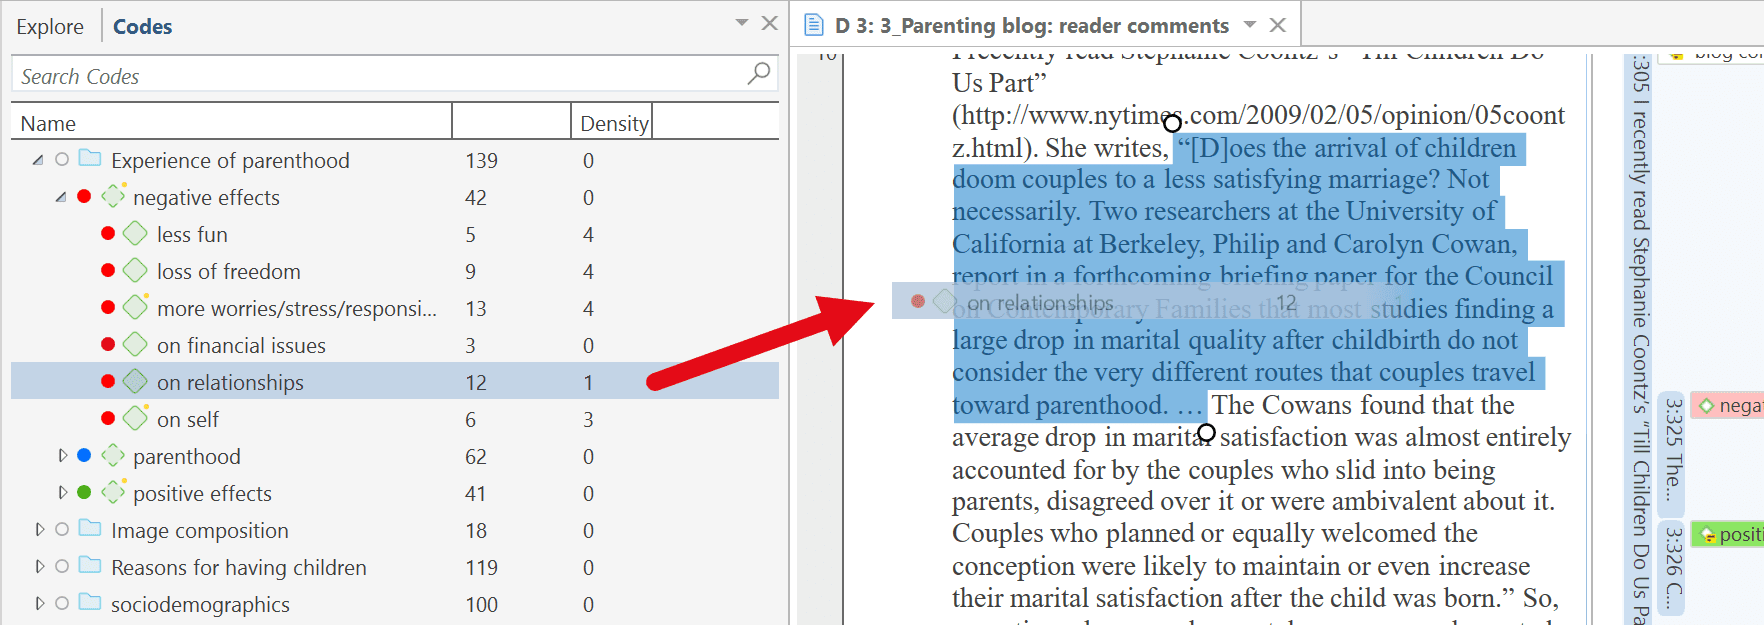
Folder: The groundedness of a folder is the number of quotations coded by independent codes or subcodes that are contained within the folder. As you can apply multiple codes to the same quotation (i.e., multi-value coding), the total can be different from adding up all the numbers for all independent and all sub codes or categories. In the above example the folder Experience of Parenthood has a groundedness of 139 quotations. This is lower than the sum for the three categories contained in the folder (42 + 62 + 41 = 145). Again, this means that some quotations are coded by more than one of the codes in the folder. Counted are only unique quotations and not the number of codings.
How Density is Counted
The code density is unrelated to the code hierarchy and the number of codings. Density is defined as the number of linkages between two codes. You can link two codes to each other via drag-and-drop, or as recommended, in a network. See the chapter on networks for further information.
Creating and Applying Codes
Video Tutorial: How to code data.
Creating New Codes without Coding
You can create codes that have not (yet) been used for coding. Such codes are called "free" codes. See Coding Data - Basic Concepts. This can for example be useful when ideas for codes come to mind during normal coding work and that cannot be applied to the current segment but will be useful later. If you already have a list of codes, possibly including code descriptions and groupings elsewhere, you can use the option: Importing A List Of Codes.
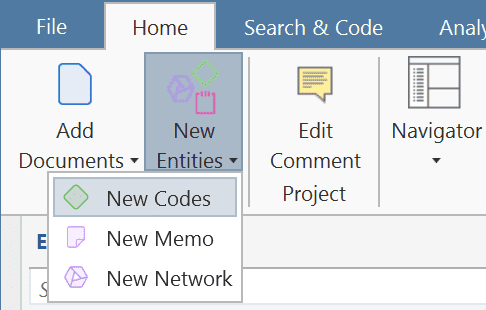
In the Home tab, click on New Entities and from the drop-down menu select New Code(s). The short-cut key combination is Ctrl+K.
You can also create new codes in the Code Manager.
Click on the button New Codes in the ribbon of the Code Manager.
Coding with a New Code
Open a document and highlight a data segment, i.e., a piece of text, audio or video data, an area in a graphic document, or a location in a geo document.
Right-click and select Apply Codes, or use the short-cut Ctrl+J, or click on the 'Apply Codes' button in the ribbon.
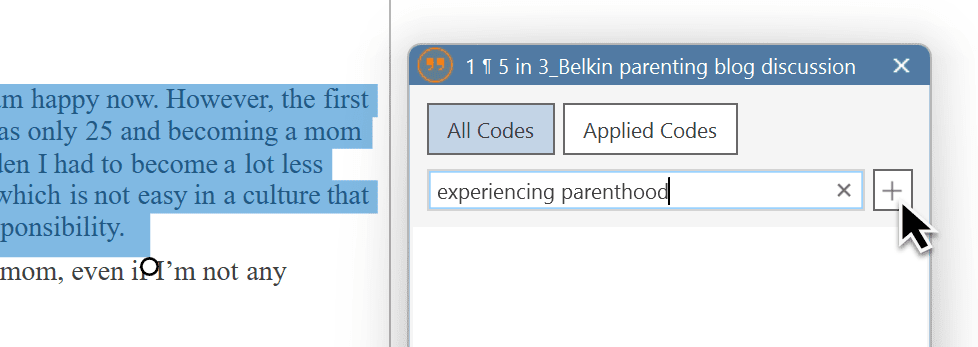
Enter a name and click on the plus button or press enter. After the code is created, you can enter a definition in the comment field.
 You can continue to add more codes, or simply continue to select another data segment. The dialogue closes automatically.
for more information on working with data other than text, see Working With Multimedia Data and Working With Geo Docs.
Code In-Vivo
Use in-vivo coding when the text itself contains a useful and meaningful name for a code.
In-Vivo coding can only be applied to textual primary documents.
In-vivo coding creates a quotation from the selected text AND uses the selected text as the code name. If the selected text's boundaries are not exactly what you want for the quotation, modifying the quotation's "spread" is often the next step after creating the in-vivo code. See Working with Codes > Modifying the length of a coded segment.
Select a segment in a text document, right-click and select Code in Vivo, or the corresponding button in the ribbon (Windows) / toolbar (Mac).
"Over-dependence on in-vivo codes ... 'can limit your ability to transcend to more conceptual and theoretical levels of analysis and insight' (Saldana, 2009:77). Where they are descriptive and unique to one person, the coder needs to move on from them quite quickly to generate a more analytical code." (Bazeley, 2013:166).
Display of Coded Data Segments in the Margin Area
The coded segment is displayed in the margin area. A blue bar marks the size of the coded segment (= quotation), and the code name appears next to it. When coding data in this way, a new quotation is created automatically, and the code is linked to this quotation.
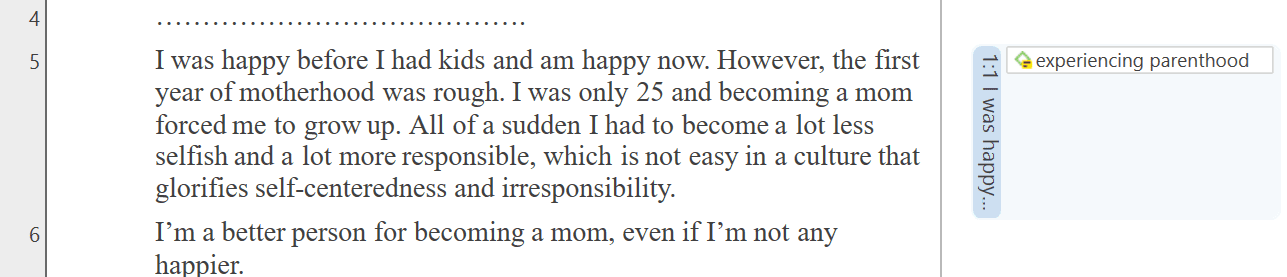
The yellow post-it within the code icon indicates that a comment has been written for this code.
Applying Existing Codes
Existing codes can be applied using the Coding Dialogue or via Drag & Drop.
Using the Coding Dialogue
Highlight a data segment, right-click and select Apply Codes, or simply double-click on the quotation.
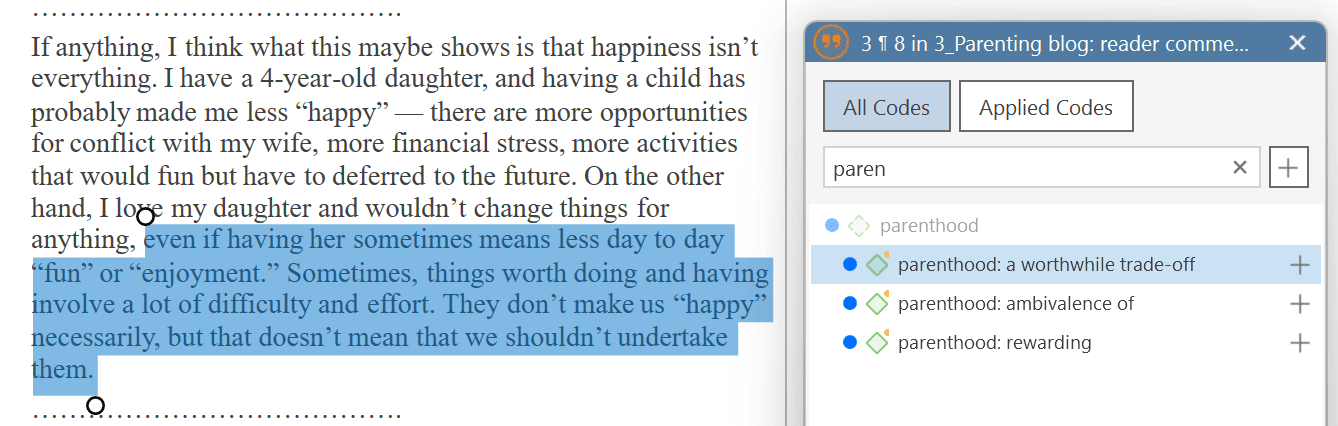 It is easy to quickly jump to the code you are looking for by entering the first few letters of the code in the search field.
Select one of the existing codes, click on the plus button or press Enter.
Drag-and-Drop Coding
Drag-and-Drop Coding is possible from the following locations:
- the Codes branch from the Project Explorer
- the Code Browser in the navigation panel.
- the Code Manager
At the end of this chapter, you find other Drag-and-Drop options that are also available for your convenience.
Drag & Drop Coding from the Code Browser
To open the Code Browser, go to the Home ribbon and select Codes from the Navigator section. The search field in the Code Browser facilitates handling a longer code list. Rather than scrolling the list, you enter the first letters of a code.
Highlight a data segment, select one or more codes from the code list and drag the code onto the highlighted data segment.
By the way, in case you were wondering, code density is not a value that is calculated by the software. It goes up, when the researcher begins to link codes to each other. See Working With Networks.
Drag & Drop Coding from the Code Manager
When using the Code Manager for drag & drop coding, it is recommended to place it next to the data you are coding into a new tab group. See Working With Docked And Floated Windows. You can quickly access codes using code groups to filter the code list, or by using the search field. In the Code Manager you can see and edit code comments.
Highlight a data segment, select one or more codes from the code list and drag the code onto the highlighted data segment.
Quick Coding
Quick Coding assigns the last used code to the current data segment. This is an efficient method for the consecutive coding of segments using the most recently used code.
Highlight a data segment or click on an existing quotation.
Right click and select Quick Coding from the context menu, or use the short-cut Ctrl+L. Another option is to click on the Quick Coding button in the ribbon.
Document Ribbon when Coding
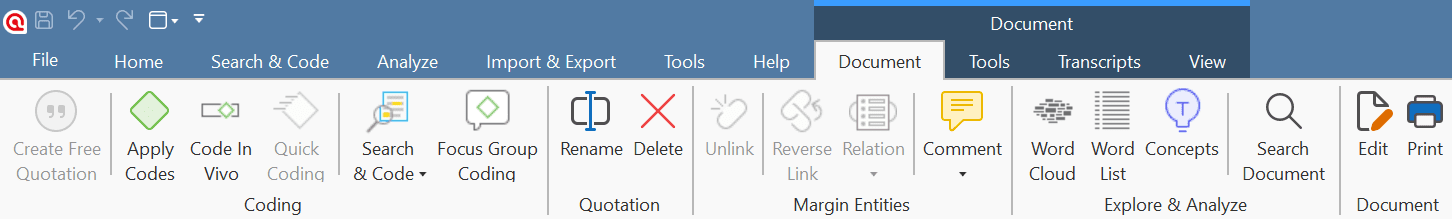
Create Free Quotation: Use of you want to create a quotation without coding it.
Apply Codes: Opens the Coding Dialogue.
Code In vivo: In-vivo coding creates a quotation from the selected text AND uses the selected text as the code name.
Quick Coding: Quick Coding assigns the last used code to the current data segment.
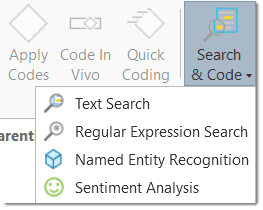
Search & Code: You can access the four Search & Code functions from here:
Focus Group Coding: You can start the Focus Group Coding function from here.
Rename: This allows you to rename a selected quotation.
Delete: Select a code in the margin area or a quotation. Only the quotation will be deleted.
Unlink: You can unlink codes from a quotation, or a hyperlink using this option.
Reverse Link: Reverses the link of a selected hyperlink.
Relation: Opens the Relation Manager.
Comment: Click the drop-down arrow and select which comment you want to view or edit.
Word Cloud: Creates a word cloud from the document.
Word List: Creates a word list from the document.
Concepts: Searches for concepts in your data to review and autocode. See Concept Search.
Search Document: Searches the content of the document.
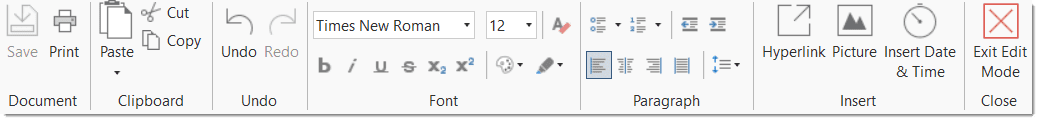
Edit: Starts edit mode, so you can modify the content of the document. When selected the ribbon changes, and you see the available edit options:
Print: Click on this option if you want to print the document as you see it on your screen including the margin area. After clicking this option, the following printer dialog opens:
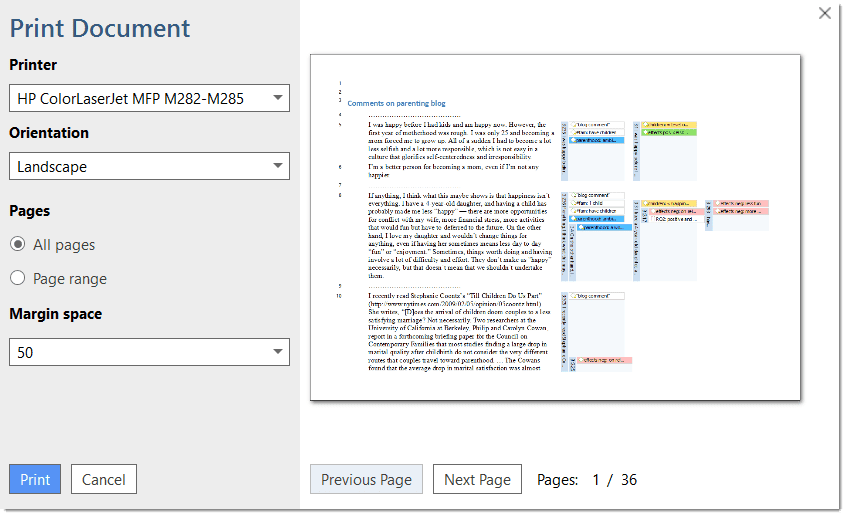
Printer: Select if you want to send the output to a printer or whether you want to save it as PDF document.
Orientation: The default selection is 'Landscape', as this is likely the best option to see the document and all codes in the margin area.
Margin space: Under 'Margin space', you can adjust the width of the margin if you need more or less space.
Pages: You can print all pages, or a page range.
With the 'Previous' and 'Next Page' buttons you can preview all pages.
The print with margin option is available for text, PDF and image documents.
Keyboard Shortcuts For Coding
| Coding | Short-Cut |
|---|---|
| Create Free Code | Ctrl+K |
| Apply Codes | Ctrl+J |
| Quick Coding | Ctrl+L |
| Code In-Vivo | Shift + Ctrl + V |
More Drag-And-Drop Options
-
You can drag-and-drop quotations in the Quotation Manager to a code in the side-panel in the Quotation Manager.
-
You can drag-and-drop quotations from the Quotation Manager to a code in Code Manager.
-
You can drag-and-drop one or more codes to a quotation in the Quotation Manager.
-
You can drag-and-drop one or more codes to a quotation in the Quotation Browser in the Navigation Panel.
-
You can drag-and-drop quotations from the Quotation Browser to a code in Code Manager.
-
You can drag-and-drop quotations from the Quotation Browser in the Navigation panel to a code in side panel of the Quotation Manager.
Working with Codes
Modifying the Length of a Coded Segment
Select the quotation by clicking on the quotation bar or code in the margin area. Then move the handle in form of a little white circles to the right or left, or up and down, depending on whether you want to shorten or lengthen the quotation.
Removing a Coding
This option is the reverse function of coding. It removes the links between codes and quotations. Unlike the delete function, neither codes nor quotations are removed; only the association between the code, and the quotation is removed.
In the Margin Area
Right-click on the code in the margin area and select the option Unlink from the context menu.
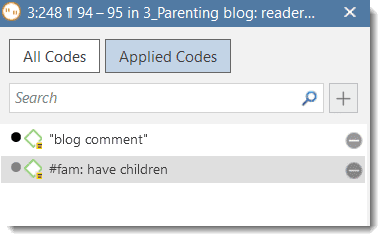
In the Coding Dialogue
Double-click on quotation in the margin area. This opens the Coding Dialogue. Click on Applied Codes to quickly see which codes have been applied to the quotation. Click on the button with the minus (-) to remove a code.
Replacing a Code via Drag & Drop
If you want to replace a code that is linked to a data segment:
You can drag and drop another code from either the Project Explorer, Code Browser, or the Code Manager on top of it.
Adding, Changing and Removing Code Color
Via the ribbon
To change the code color, select one or multiple codes in the Code Manager and click on the Change Color button in the Code ribbon. Select one of the offered colors.
To remove code color, select one or multiple codes in the Code Manager, click on the Change Color button in the Code tab and click on Remove color.
Code color can also be modified in a network. See Further Options in Networks.
Via the context menu
Select one or multiple codes in the Code Manager, the Project Explorer or Code Browser, right-click and select Change Color from the context menu. Select one of the offered colors.
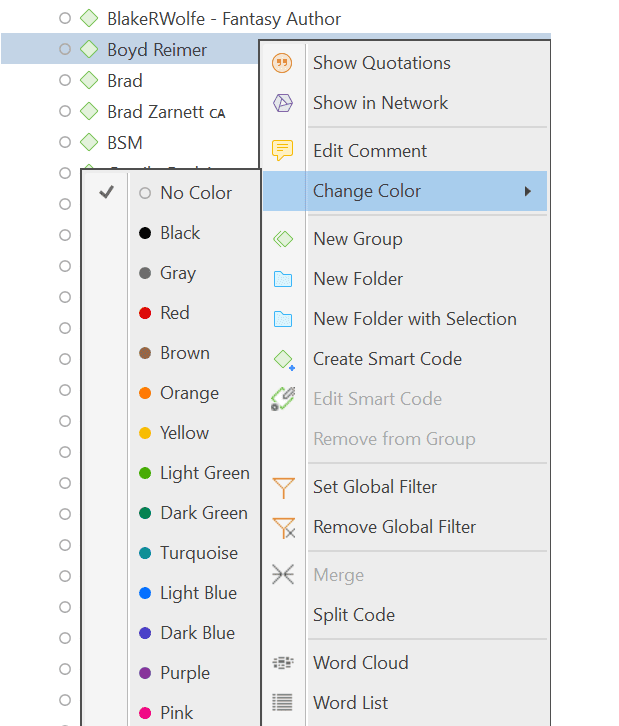
The default color palette is suitable also for colorblind people. Additional colors can be added if you import a list of codes from Excel. See Importing code lists.
Renaming a Code
Right-click on a code in the margin area and select the Rename option from the context menu.
Other places where you can rename a code are:
In the Project Explorer, the Code Browser, or Code Manager, right-click on a code and select the Rename option. In the Code Manager, you can also click the Rename button in the ribbon. Another option is to click the F2 key.
Deleting One or Multiple Code(s)
In the Project Explorer, the Code Browser, or Code Manager, right-click on a code and select the Delete option. In the Code Manager, you can also click on the Delete button in the ribbon.
About Renaming, Deleting and Unlinking Codes
Renaming and deleting codes are procedures that seem trivial, but understanding the scope of these operations can be a problem for new users. For both operations you must understand, that there is only ONE code, for example 'source of happiness: children' in a given project, even if you applied this code many times.
In the margin are, you may see the code appear many times while scrolling through your document. In fact, you are seeing the codings for this code. Technically speaking, these are links between a quotation represented by a blue bar and the code, represented by its name and icon.
Removing a coding in the margin area (i.e., unlinking the code) is like erasing a word in the margin of a paper document with an eraser. It only affects one coding, i.e., one specific occurrence of the code. All other occurrences of the same code are untouched. The effect of the operation is local.
By renaming or removing a code from a project, you are affecting every occurrence of the code throughout the entire project. The effect is global. Renaming the code will instantly change all the code links in the margin to reflect the new name. Deleting it will remove all occurrences in the margin (and from all other contexts in which it was engaged, like networks, groups, etc.).
Duplicating a Code
It is also possible to duplicate codes with all its linkages. The duplicated code is a perfect clone of the original code including color, comment, code-quotation links, code memo links and code-code links. Duplicating a code can be a useful option to clean up or modify a code system.
To duplicate a code, open the Code Manager, select one or more codes, right-click and select the Duplicate Code(s) option from the context menu. Another option is to select the Duplicate Code(s) button in the ribbon. The clone has the same name as the original code plus a consecutive number, i.e., (2).
This option is also available in the Network Editor. See Further Options in Networks.
Writing Code Comments
Code comments can be used for various types of purposes. The most common usage is to use them for a code definition. If you work in teams, you may also want to add a coding rule, or an example quote. If you work inductively, you can use code comments to write down first ideas of how you want to apply this code. You can also use it to write up summaries of all segments coded with this code and your interpretation about it. There are several ways to write a code comment.
- Adding a code comment when creating a new code in the coding dialog:
Enter a new code name and click on the + to create the code. Now you can enter a description or code definition in the comment field.
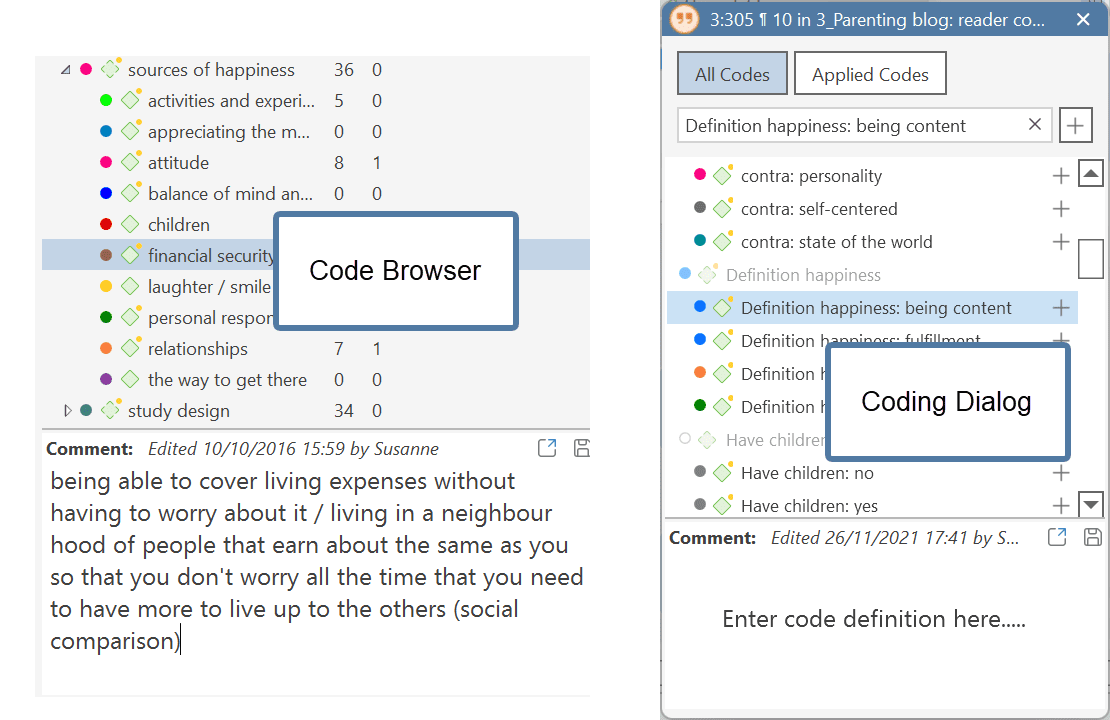
- Select a code in the Project Explorer or the Code Browser. The comment field is shown below the list.
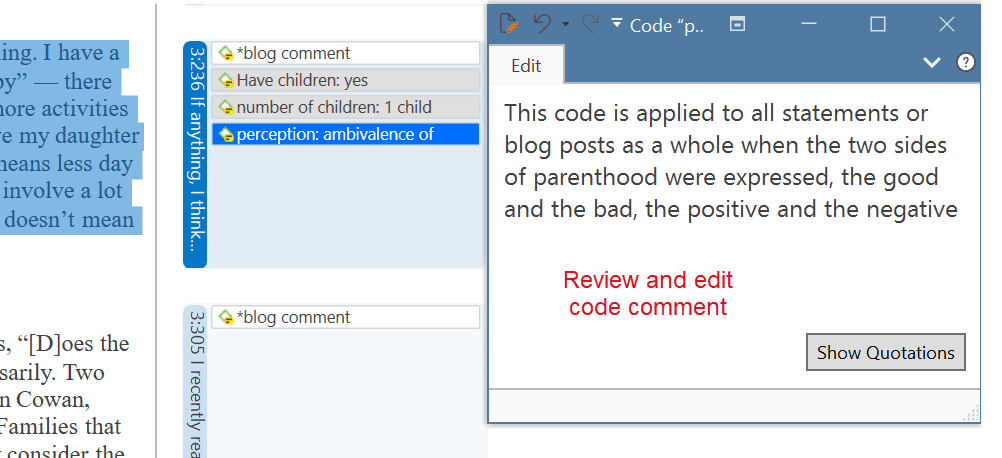
- In the margin area, you can double-click on a code to open the editor for writing a comment editor. Another option is to right-click on a code and select the Edit Comment option from the context menu. You can also click on the Edit Comment button in the ribbon of the contextual Code tab.
- In the Code Manager is open, you can use the comment field at the bottom of the window. Note that you can switch between seeing bar charts or the comments.
Another option is to right-click on a code anywhere and select the Edit Comment option from the context menu.
All codes that have a comment shows a little yellow dot on top right-hand side of the code icon.
Creating Categories and Subcodes
Video Tutorial: Building a code hierarchy. If you want to sort your codes into higher and lower order codes, you can make use of categories and subcodes. An additional way to organize your codes are folders. Folders can contain other folders. This gives you multiple levels of organizing your codes. Only independent codes and subcodes can contain coded data. The reason for this is methodical rather than technical. If you use a deeper hierarchy, you will likely start duplicating and even multiplying codes at the lower levels. Not only does this make your code system long and difficult to maintain, it also prevents you from performing effective comparative analysis. Below we quote just one of the many authors who offer this advice:
"If you have a typical project of moderate complexity, it should require no more than 10 top-level [parent] categories" to cover the topic [...]. Furthermore, most code systems do not go more than two or three levels deep. If they do, it is likely that the categories being used are no longer true subcategories of the higher-order categories they are under; and, on a practical level, it becomes inconvenient for the coder to remember, locate, and effectively use them" (Bazeley, 2013. p. 183).
See also: How to build a code system.
An additional way to organize your codes are folders. You can add independent codes and categories with their subcodes to folders. Folders can also contain other folders. This allows you to group codes under themes or topics that are too abstract anyway to be used for coding.
Below is an example showing a 3 level hierarchy, illustrated using the ATLAS.ti network function:
Creating Categories with Subcodes
There are two ways to create a category: by moving codes via drag & drop under a free code, or by splitting a code that already has codings.
Moving Codes under a Free Code
Create a new code.
Select one or more codes in the code list using the common selection techniques for multi selections.
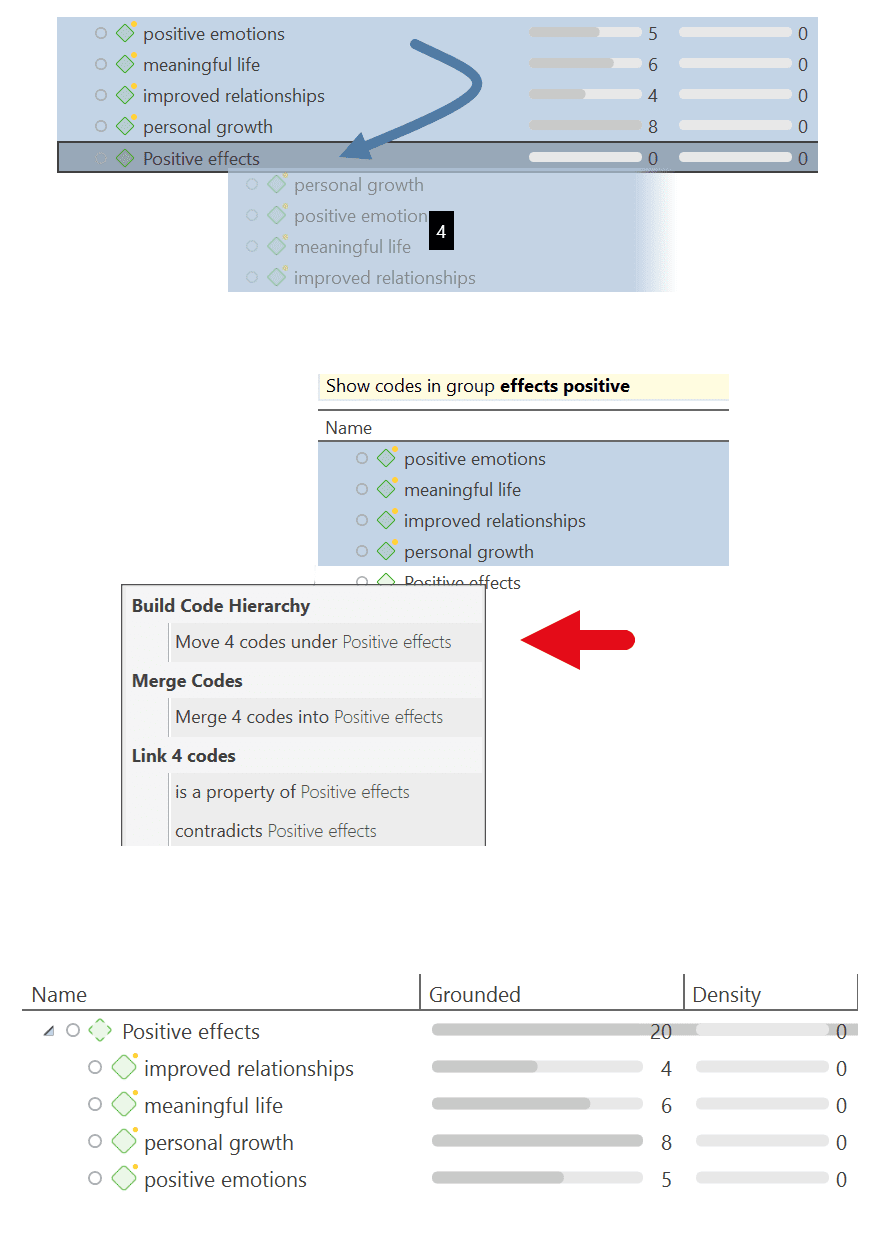
Drag the codes to the newly created code. A context menu opens. Select the first option: Build Code Hierarchy:
Once you have added subcodes to an independent code, it becomes a category. The code icon changes. See image below.
Creating a Category via Splitting
Select a code that you want to split into subcodes.
Right-click and select the option Split into Subcodes, or click on the dropdown next to Split in the ribbon and select Split into Subcodes from there. The Split Code tool opens.
Click on Add Codes to enter the labels for the subcodes. After entering the first code, press the down arrow to move to the next entry field to enter the second label, and so on. Once you are done, click on Add.
By default, a subcode with the name Undecided is added to the first column of the table. All quotations are added to this subcode. The next step is to assign the quotations to the new subcodes you have created. If a quotation does not fit into any of these subcodes, you can just leave it in the subcode 'Undecided'.
This is how you assign the quotations to one or more subcodes:
Select a quotation. Its content is shown at the bottom of the screen. Assign the quotation by clicking on the checkbox of the subcodes that apply.
To speed up the process, you can press the number keys (1,2,3, usw.) to assign the selected quotation to subcode 1, 2, 3, usw.
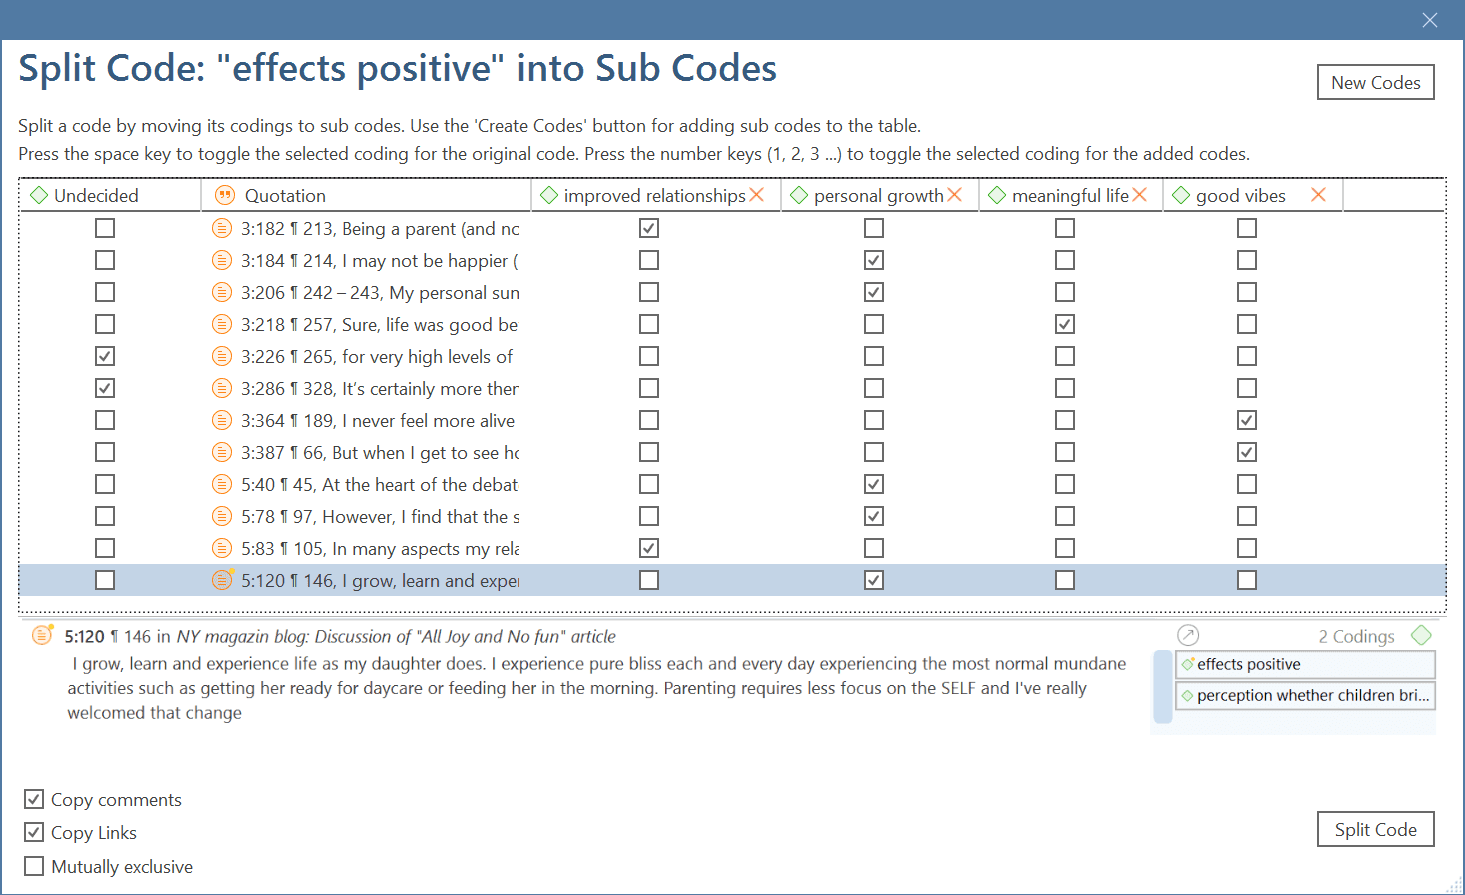
Mutually exclusive: If you do not want to allow that a quotation is coded with two of the subcodes, activate the option Mutually Exclusive. This is a requirement for some content analysis approaches and for calculating inter-coder agreement. See Requirements for Coding.
Once all quotations have been assigned to one or more subcodes, click on Split Code. The code that you split will be turned into a category. This is indicated by the changed code icon. If you click on the drop-down arrow in front of the code, you can expand the category to see the subcodes.
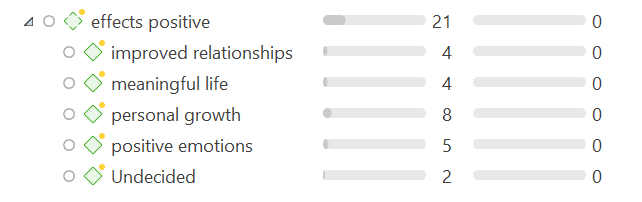
The groundedness of a category code is the number of quotations coded by all of its subcodes. Since you can apply several codes to the same quotation, the total for a category can differ from simply adding up quotations for all subcodes. Both sums are only equal, if you use subcodes in a mutual exclusive manner.
Creating category and subcodes in the coding dialog
When double-clicking on a quotation in the margin, or when highlighting a data segment and selecting the Apply Codes option from the context menu, the coding dialog opens. You can create a new category with a subcode directly here in the dialog, or add a new subcode to an existing category.
Adding a category with subcode
In order to create a category code with a subcode, you simply have to enter as label: category name: subcode name:
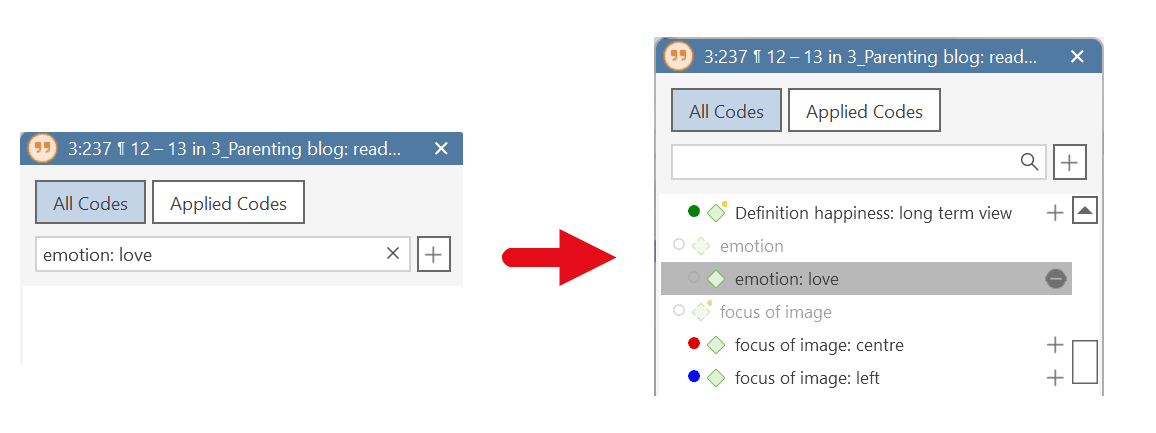
Adding a new subcode to an already existing category
Start typing the name of the category code. This filters the code list.
Select one of the existing sub codes, highlight the subcode name and type over the new name, or delete that part of the name first and then add the new subcode name.
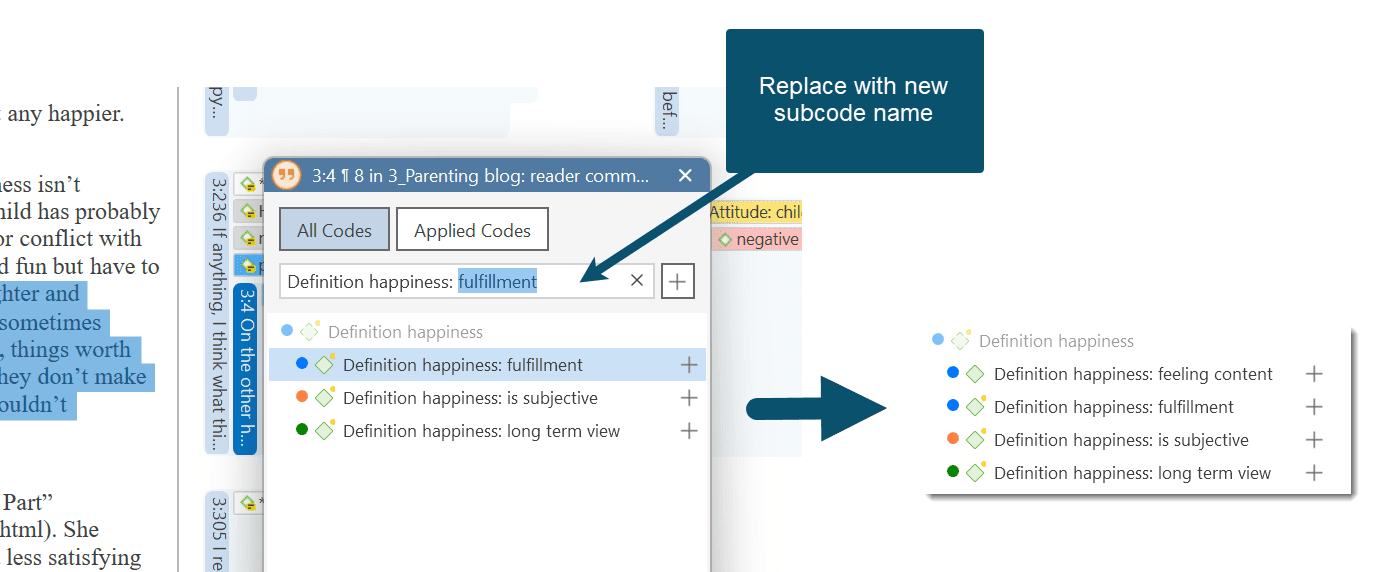
Easy coding with subcodes of a category
There is a very easy way to apply subcodes to your data via drag & drop coding.
Highlight a section of your data and drag & drop a category code from other the project explorer, code browser or code manager onto the text.
A window pops up showing you the list of subcodes. Select one of the subcodes to code.
If you select an existing quotation and one or more subcodes of the selected category have already been applied, this is indicated by a check mark.
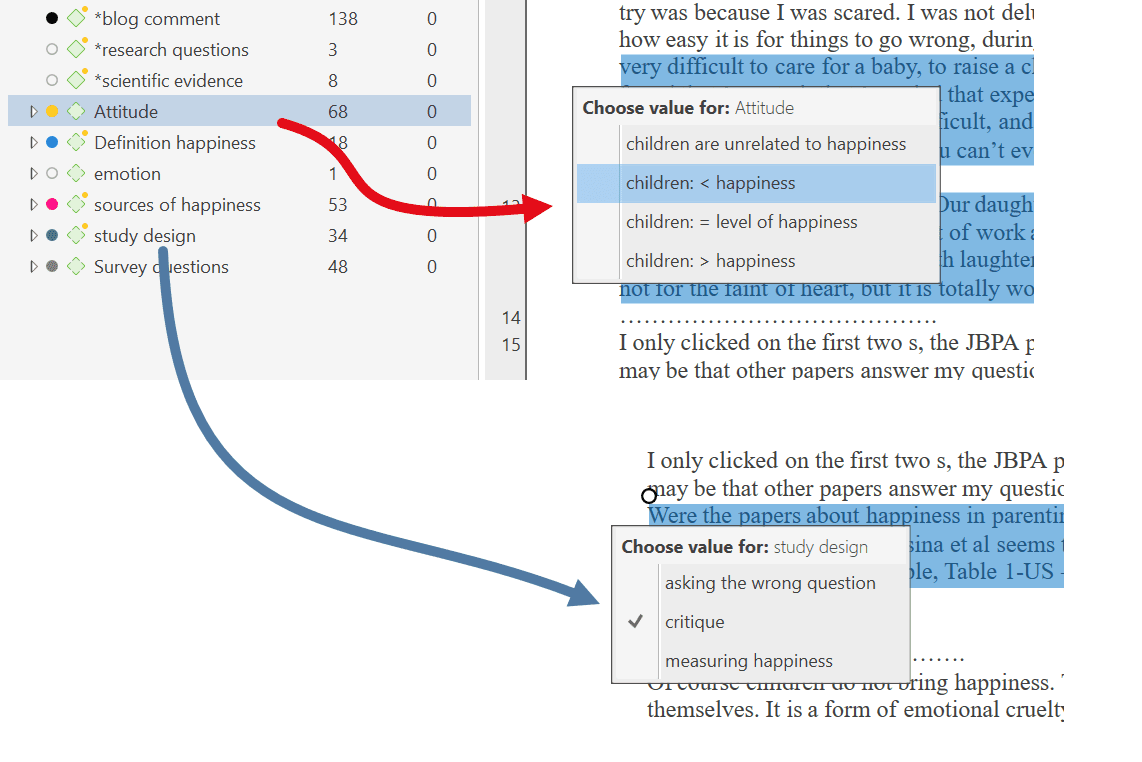
How to move subcodes out of a category
You have two options, you can move subcodes from one category to another category via drag & drop.
If you want to move subcodes out of a category to the first level, they become independent codes again. If you move all subcodes, the category code also becomes an independent code again.
Highlight the subcodes you want to move and drag them to the left side until you see a black vertical line, then drop:
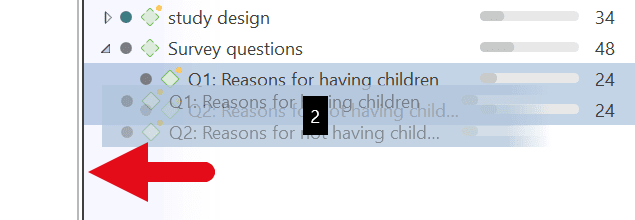
The subcodes will be sorted into your code list in alphabetic order. The groundedness of the category wil be adjusted. In the example illustrated below, all subcodes were moved out of the category; the category has become an independent code with groundedness 0:
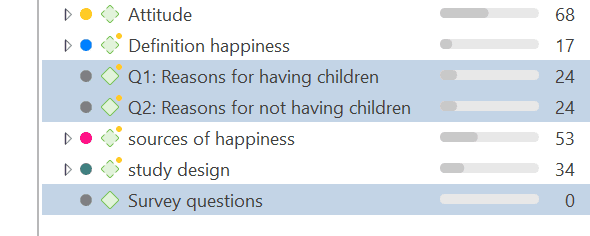
Organizing Codes in Folders
Independent codes or categories with their subcodes can be organized into folders. In contrast to code groups, a code or a category cannot be in more than one folder. The folder structure is hierarchical, code groups are not.
Folders can be contained in other folders. There might be projects that require a fourth level of organization. Below you find an example with three levels. See also the recommendations in the chapter How to build an effective code system.
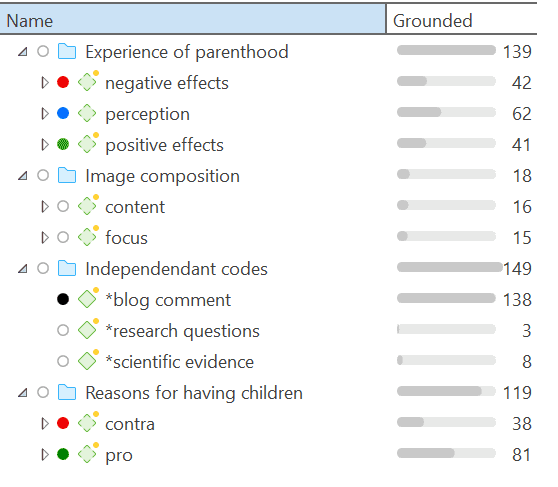
How to create folders
In the Code Manager ribbon, click on the New Folder icon.
Or:
Select one or more codes or categories, right-click and select the option New Folder with Selection from the context menu.
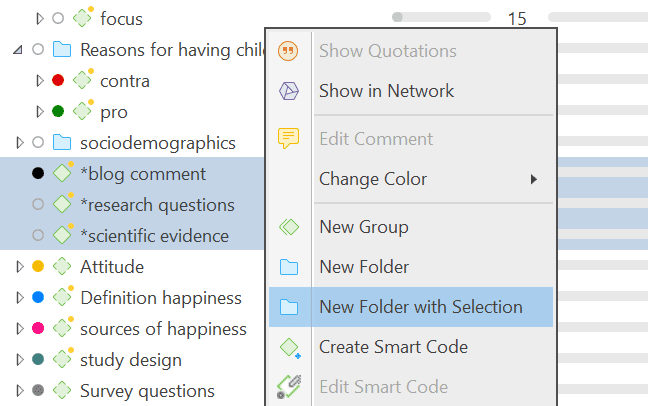
If you delete a folder, all content in the folder is also deleted.
How to move items between folders or out of a folder
You have two options: You can move independent codes, categories, or subcodes from one folder to another folder via drag & drop. The second option is to highlight all items that you want to move, and drag them to the left side until you see a black vertical line; then drop.
Automatically Code Data
With the recent advances in deep learning, the ability of algorithms to analyse text has improved considerably. Creative use of advanced artificial intelligence techniques can be an effective tool for doing in-depth research.
Under the Search & Code tab, ATLAS.ti offers five ways of searching for relevant information in your data that can then be automatically coded.
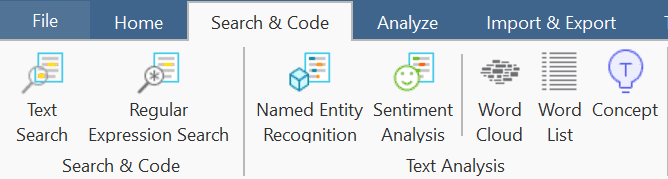
- Find Concepts and Auto-code
- Text search
- Expert search with regular expressions
- Named Entity Recognition (NER)
- Sentiment Analysis
If you enter a term for a text search, you can select similar words from a list of synonyms. Synonyms are available in English, German, Spanish, Portuguese, French, Dutch, Russian and Simplified Chinese.
Language models for the above-listed languages are also available for Named Entity Recognition, Sentiment Analysis, and Concept Search.
As ATLAS.ti is a tool for qualitative data analysis, the process is not fully automated. Before coding the data, you can review all results, make modifications or decide not to code certain finds.
Artificial intelligence techniques have been developed for big data analysis. The data corpora usually handled by ATLAS.ti are considerably smaller. Thus, you cannot expect all results to be perfect. Reviewing the results will be a necessary component of the analysis process when using these tools. When working with the tools, you will see that the tools will add another level to your analysis. You find things that you simply do not see when coding the data manually, or would have not considered to code. We, at ATLAS.ti, consider manual and automatic coding to be complementary; each enhancing your analysis in a unique way.
Retrieving Coded Data
Video Tutorial: Retrieving coded data.
From the Project Explorer, Code Manager or Code Browser
Double-click a code. This open the Quotation Reader and you can review all codings.
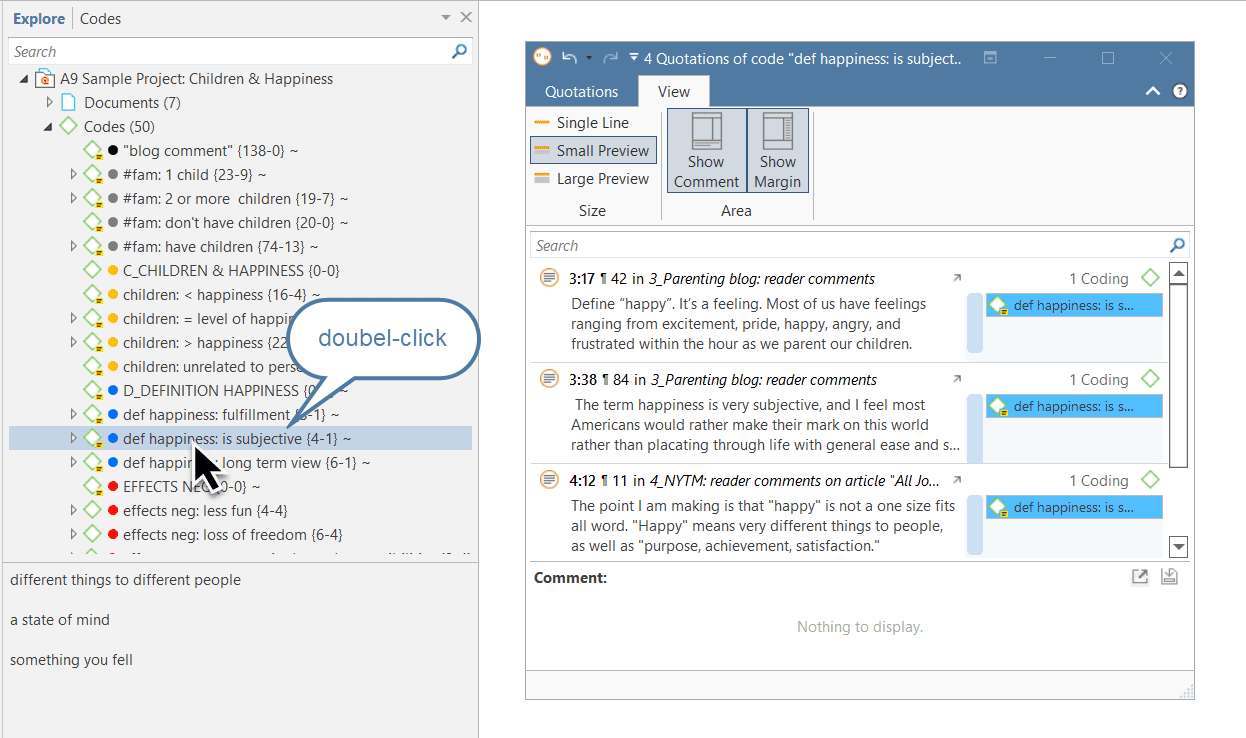
If you prefer to read the data in context, you can dock the Quotation Reader to the right or left-hand side of your screen in single line format. To do so:
Select the option Dock to Navigation Area in the ribbon:
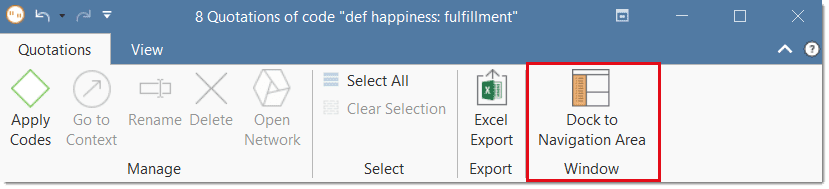
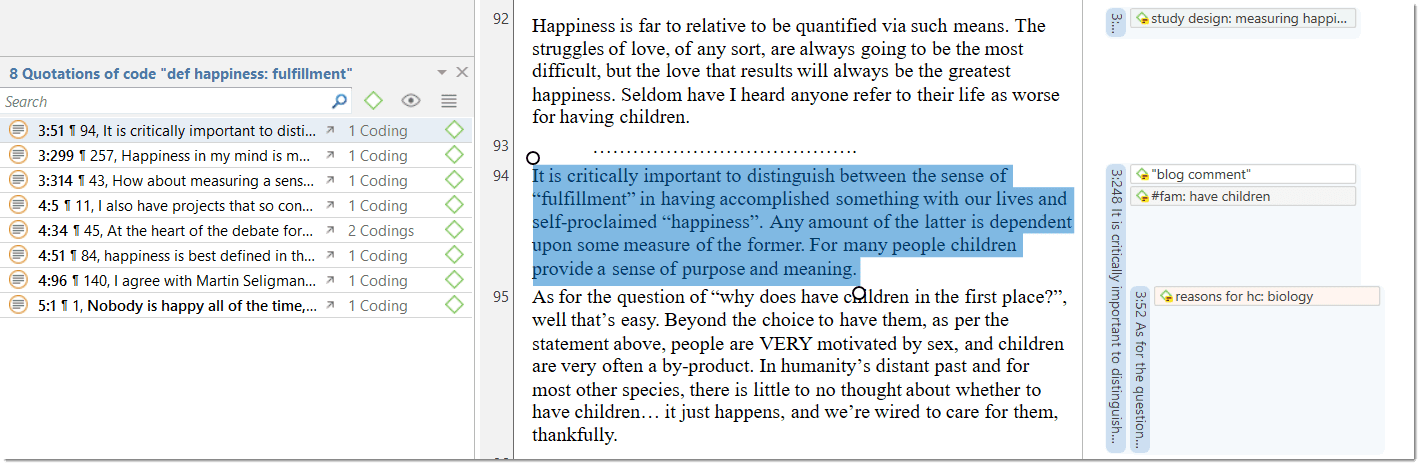
Simple Retrieval in the Margin Area
If you double-click on a code in the margin area, the comment field opens. From there you can access the quotations coded with the code.
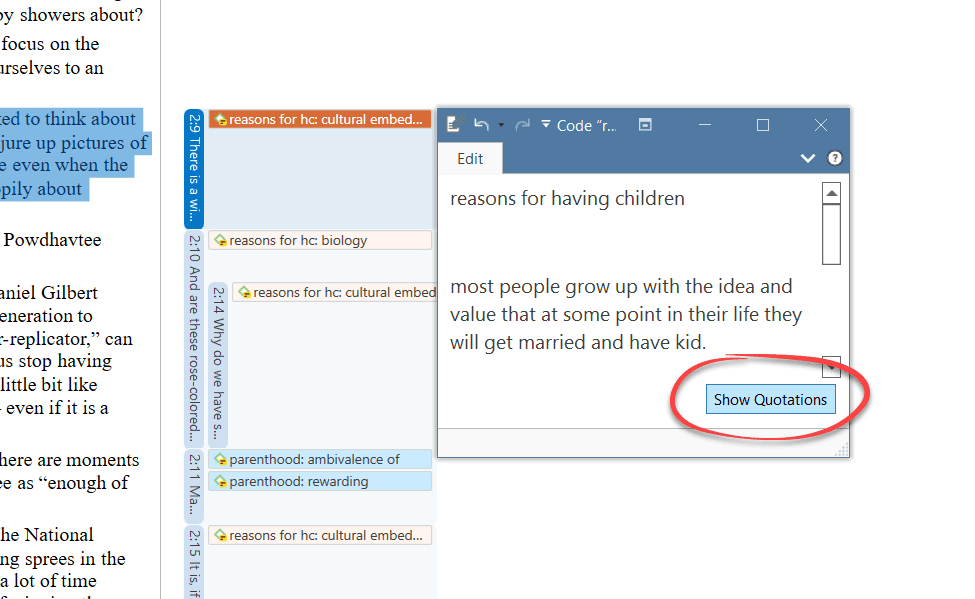
Simple Boolean Queries in The Quotation Manager
Open the Quotation Manager.
Select a code in the filter area. If you have a long list of codes, you can enter a few letters into the Search Code field to reduce the list to only the codes you are looking for:
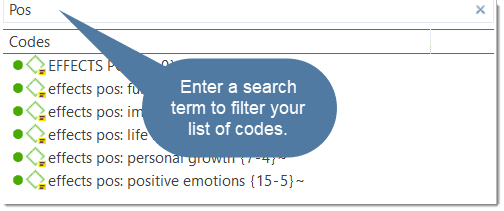
The list of quotations only shows the quotations of the selected code. If you click on a quotation, it will be shown in the preview area. If you double-click, the quotation will be shown in the context of the document.
The yellow bar on top shows the code(s) you are using as filter.
When selecting two or more codes in the side panel, the filter is extended to an OR query: Show quotations coded with of ANY of the codes.....
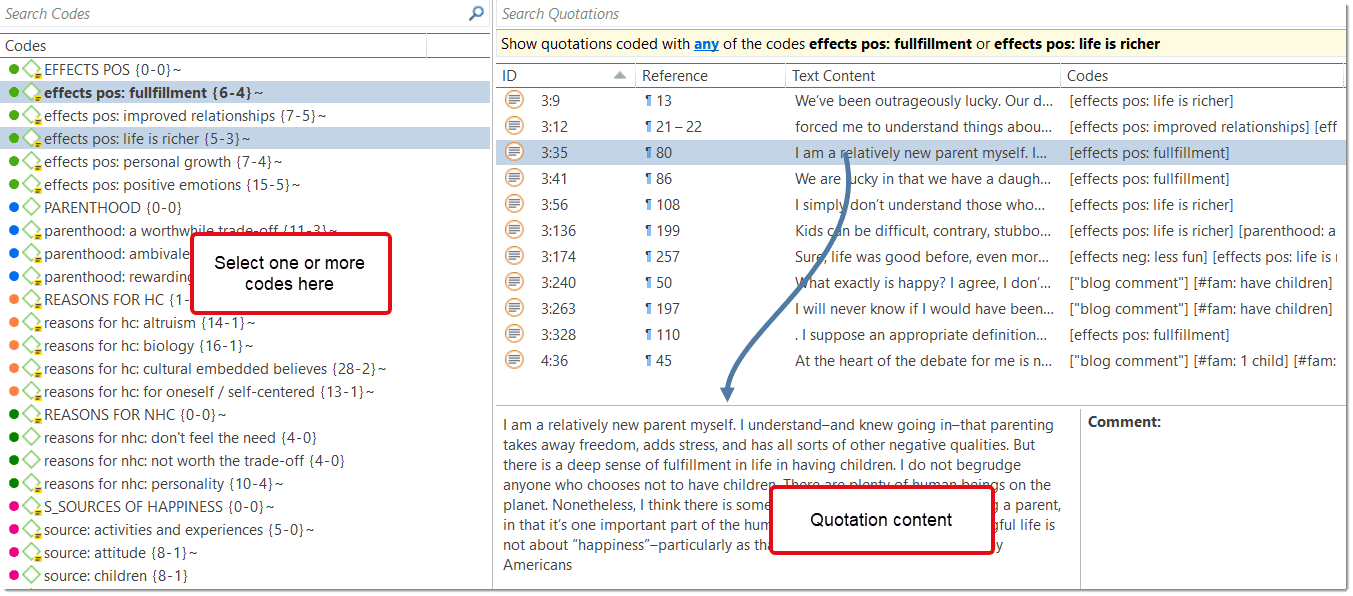
Click on the blue underlined any operator. This opens a drop-down, and you can change between ANY and ALL.
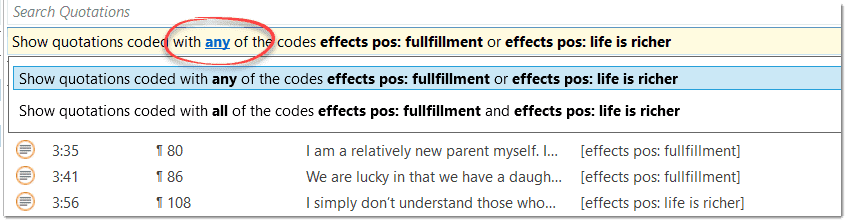
-
ANY: Show all quotations linked to any of the selected codes.
-
ALL Show quotations where all the selected codes apply. This means that two or more codes have been applied to the exact same quotation.
If you want to export the results, click on either the Report or Excel Export button in the ribbon. Find more detail see Creating Reports.
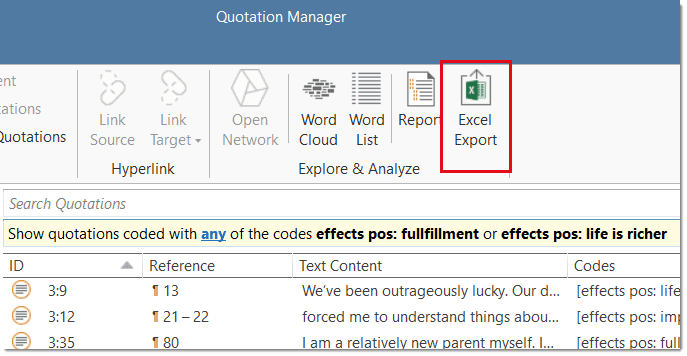
Merging Codes
Video Tutorial:
You may begin your coding very close to the data generating lots of codes. In order not to drown in a long list of codes, you need to aggregate those codes from time to time, which means merging and renaming them to reflect the higher abstract level. Another reason for merging is that you realize that two codes have the same meaning, but you have used different labels.
Moving all low frequency codes under a category code to "clean up" is not a good solution. You may start by using descriptive labels for independent codes, but you need to aggregate them at some point, usually after having gone through your first few sources. If you have too many of those low frequency codes, you create a proliferating coding system that becomes unmanageable (Bazeley, 2013). In addition, it will also not be very useful for your analysis.
There are a few exceptions as always. Codes with low frequencies that capture an exceptionally insightful thought, for instance, don't and also should not be merged. There should only be a few of those and not dozens or hundreds.
This is how you do it:
Select two or more codes in the Code Manager and drag them to the code where you want to merge them into. A menu opens. Select the second option Merge code ... into ...
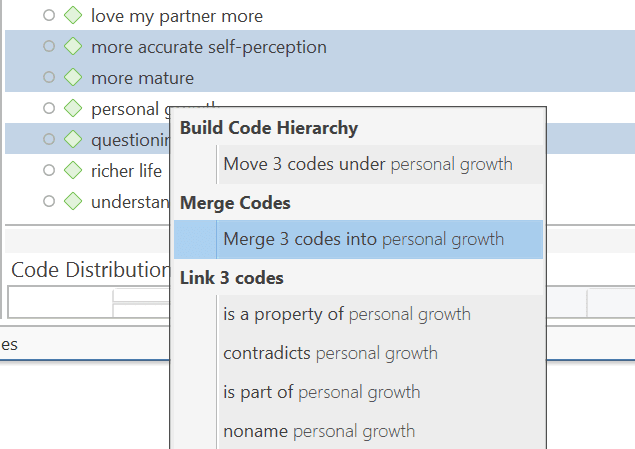
A comment is automatically inserted into the target code that provides an audit trail of which codes have been merged. If the codes that are merged had a comment, these comments are also added to the target code.
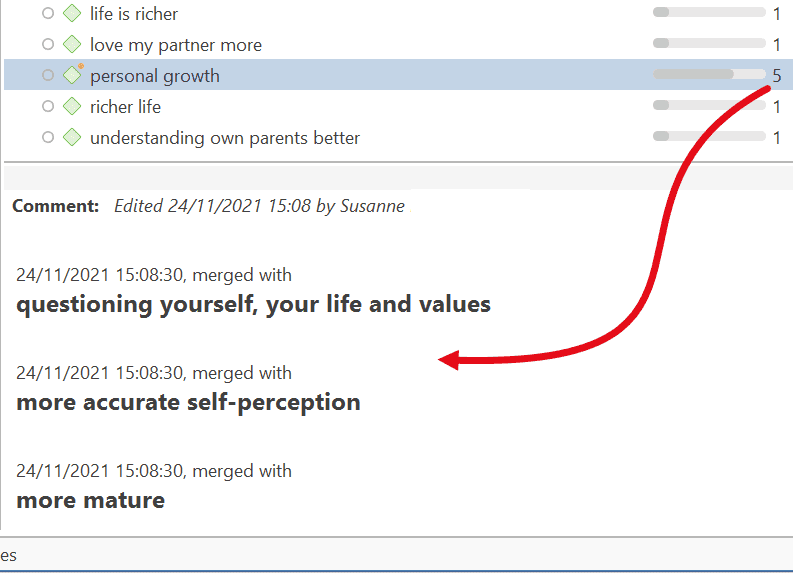 Another option is to select the Merge Codes option from the context menu, or the ribbon.
Select two or more codes in the Code Manager and click on the Merge button in the ribbon (or right-click and select the Merge option from the context menu).
Next, select the target code into which all other codes should be merged, and click on the Merge Codes button.
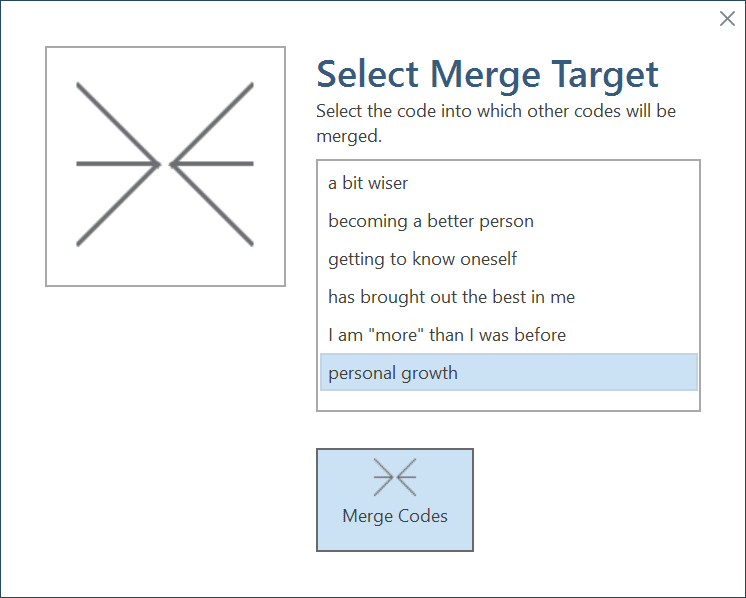
It is also possible to use the network editor for merging codes. This provides a visual space where you can arrange your codes, review, sort and order them and decide which once to merge. See Networks: Further Options.
Splitting a Code
"Inevitably, not all codes you produce will continue to prove useful. Some will be too general, others too specific to one or two segments of data (see Merging Codes). With the exception of contextual codes, a category that is so broad or so vaguely defined that it codes a very large number of passages or very lengthy passages is less likely to be useful in analysis" (Bazeley, 2013:185).
Splitting a code is necessary if you have been lumping together many quotations under a broad theme. This is a suitable approach for a first run through to get an idea about your data. At some point those codes need to be split up into codes with a lower number of codings or into subcodes of a category to be meaningful for analysis.
This can be done in two ways:
- Splitting into independent codes
- Splitting into subcodes (creating a category)
Splitting a code into independent codes
Select a code that you want to split in the Code Manager, and click the Split Code button in the ribbon. Or select a code in the Code Manager, Project Explorer or Code Browser, right-click and select Split from the context menu.
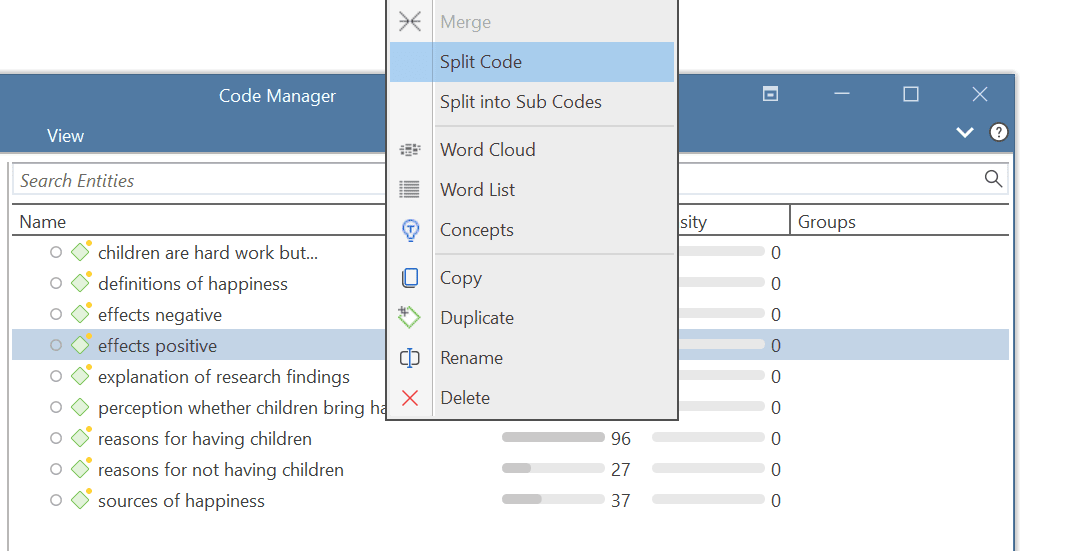
In the Split Code tool, you see the list of the quotations coded with the code.
Click on New Codes to enter the labels for the subcodes. After entering the first code, press the down arrow to move to the next entry field to enter the second label, and so on. Once you are done, click on Create.
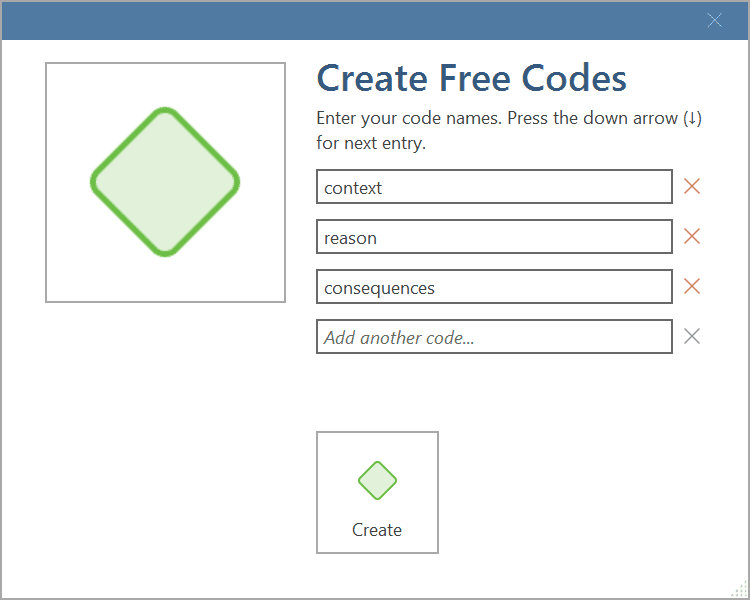
By default, the name of the original codes is added to the first column of the table. All quotations are still linked to it. The next step is to assign the quotations to the new codes you have created. If a quotation does not fit into any of these new codes, you can just leave it linked to the original code.
This is how you assign the quotations to one or more subcodes:
Select a quotation. Its content is shown at the bottom of the screen. Assign the quotation by clicking on the checkbox of the codes that apply. The quotation is automatically unlinked from the code that you are splitting.
To speed up the process, you can press the number keys (1,2,3, usw.) to assign the selected quotation to subcode 1, 2, 3, usw.
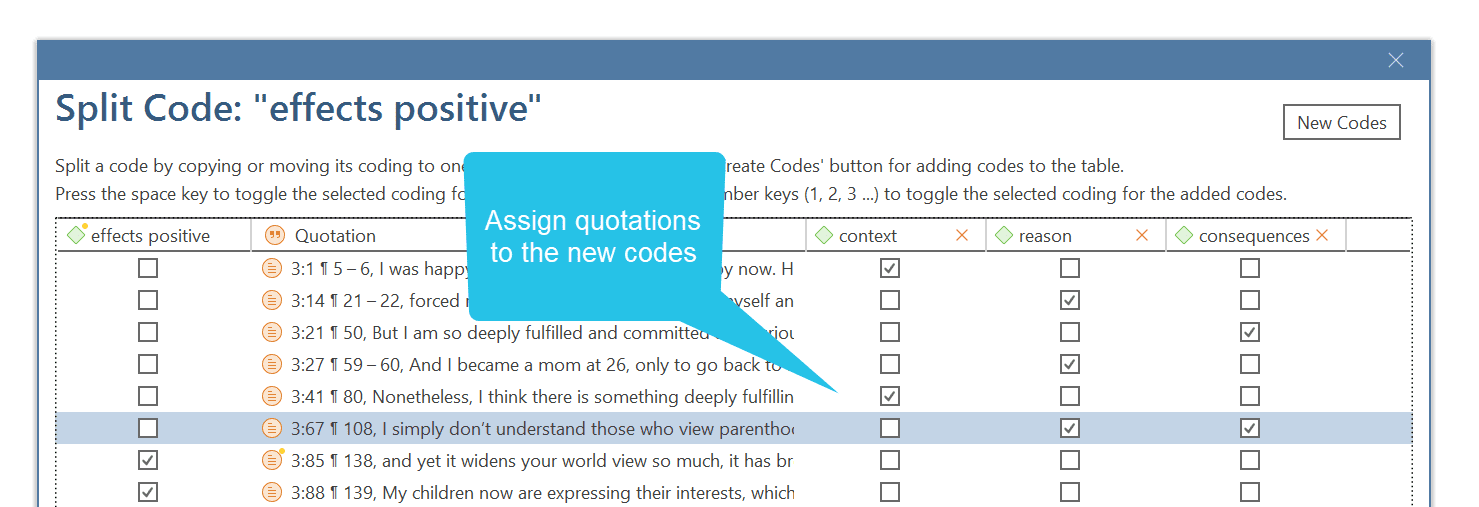
After you have distributed some or all of the quotations into sub codes, click on Split Code. Now the new codes are created, and the quotations are assigned accordingly.
It is not required that you assign all quotations to the new codes. Quotations can remain linked to the original code, or also to the original code and any of the newly created codes.
Options
-
Copy Comments: Select if you want all sub codes to have the same comment as the code you split.
-
Copy links: Select if you want all sub codes to inherit existing links to other codes or memos.
-
Mutually exclusive: If activated, you can assign a quotation to only one sub code. This is a requirement for some content analysis approaches and for calculating inter-coder agreement.
Mutually Exclusive Coding
If you do not want to allow that a quotation is coded with two of the codes, activate the option Mutually Exclusive. This is a requirement for some content analysis approaches and for calculating inter-coder agreement. See Requirements for Coding.
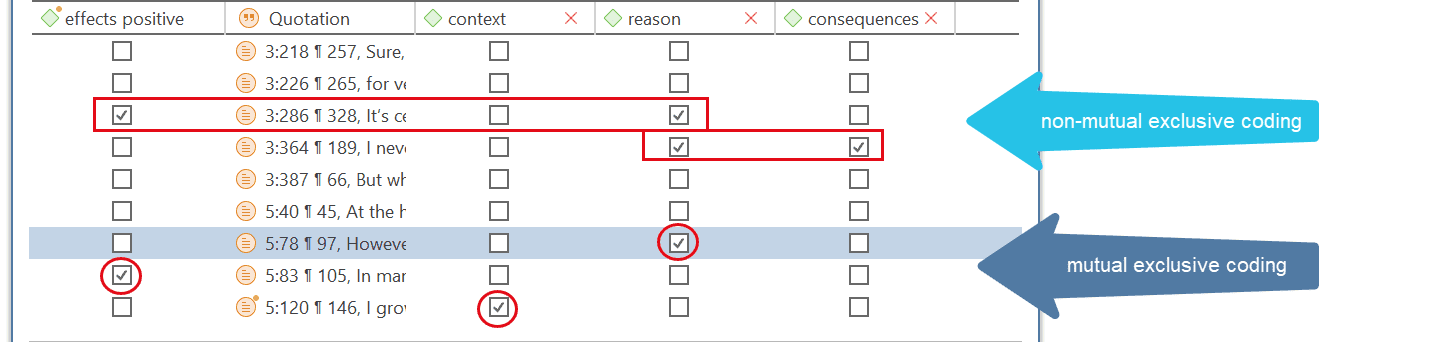
Splitting a code into a category and subcodes
Select a code that you want to split into subcodes.
Right-click and select the option Split into Subcodes, or click on the dropdown next to Split in the ribbon and select Split into Subcodes from there. The Split Code tool opens.
Click on New Codes to enter the labels for the subcodes. After entering the first code, press the down arrow to move to the next entry field to enter the second label, and so on. Once you are done, click on Create.
By default, a subcode with the name Undecided is added to the first column of the table. All quotations are added to this subcode. The next step is to assign the quotations to the new subcodes you have created. If a quotation does not fit into any of these subcodes, you can just leave it in the subcode 'Undecided'.
This is how you assign the quotations to one or more subcodes:
Select a quotation. Its content is shown at the bottom of the screen. Assign the quotation by clicking on the checkbox of the subcodes that apply. The quotation is automatically unlinked from the subcode 'Undecided'.
To speed up the process, you can press the number keys (1,2,3, usw.) to assign the selected quotation to subcode 1, 2, 3, usw.
Mutually exclusive: If you do not want to allow that a quotation is coded with two of the subcodes, activate the option Mutually Exclusive. This is a requirement for some content analysis approaches and for calculating inter-coder agreement. See Requirements for Coding.
Once all quotations have been assigned to one or more subcodes, click on Split Code. The code that you split will be turned into a category. This is indicated by the changed code icon. If you click on the drop-down arrow in front of the code, you can expand the category to see the subcodes.
The groundedness of a category code is the number of quotations coded by all of its subcodes. Since you can apply several codes to the same quotation, the total for a category can differ from simply adding up quotations for all subcodes. Both sums are only equal, if you use subcodes in a mutual exclusive manner.
Building a Code System
A well-structured code list is important for further analysis, where you look for relationships and patterns in the data, with the goal of integrating all results to tell a coherent story. If, as in a survey, you only have questions with the answer categories "yes" and "no" in your questionnaire, your data will only consist of nominal variables. This means that the analysis is limited and does not go beyond the descriptive level. This is comparable to a codebook that consists of a set of codes whose analysis level remains indefinite. The aim of building a code system is that you can access your data through the codes and that you can make full use of the analysis tools.
At the end of the chapter you will find a list of articles and books based on which the following recommendations were written.
How to Begin Building a Code System
Unless you are working with theoretically derived a priori codes, to start with, you will be creating codes to catch ideas as they happen. The list of code grows, and it becomes more and more difficult to keep an overview. It is time to begin managing your list of codes. This can be after coding one document, one interview or a few. Managing your code means to start sorting and ordering them into folders, categories and subcodes. Code groups can help in this process as well. Via code groups you can collect codes that are connected. Then set the code group as filter so that you can focus on this smaller subset of codes. Which codes might form a category, which ones need to be merged or split?
Applying a hierarchically organised catalogue to your code system has several benefits. See also Bazely (2013:179-183).
-
It creates order: you know where to look to place or find a particular code
-
It brings conceptual clarity for yourself and others
-
It provides a prompt to code additional aspects as you continue to code. You are for instance reminded to code for 'reasons for having children', 'sources of happiness', 'definition of happiness', etc. because you have a category for these types of things. It also sensitizes you to notice other subcodes that appear in the data.
-
it will assist you in identifying patterns of relationships in your data. Not only will you be able to ask questions about a particular category, this will also allow you to explore relationships between categories, e.g., between emotions and events. You can for instance explorer whether particular events regularly bring forth particular emotions. This can best be achieved if the kinds of things whose associations you want to explore are coded to different categories, in this case a category 'Emotion' with the various types of emotions as subcodes, and a category 'Event' with the various events as subcodes. Hence, you only need a 2-level hierarchy consisting of categories and subcodes.
Several authors provide suggestions in what kind of ways codes in a code system might be grouped. Lofland (1971) for example suggested acts, activities, meanings, participation, relationships, and settings. Bogdan and Biklen (1992) proposed setting/context, definition of the situation, perspectives, understandings of people and objects, process, activities, events, strategies, relationships and social structure. Bazeley (2013) added people/actors/players, issues, i.e., matters raised about which there may be some debate, attitudes, beliefs, ideological positions, frameworks, cultural context, emotional responses or states, personal characteristics, impact/outcomes (facilitator or barriers).
You may find that some of these ideas easily translate into a category with subcodes; others might be too abstract to code with them. Instead, they can be used at the folder level. Within the folder you can develop categories with subcodes which can be applied to code the data.
Below we show you an example. In the first screenshot, you only see the folder and category level. Code groups have been created as means to filter on folder and category level for different purposes. See Further Data Analysis
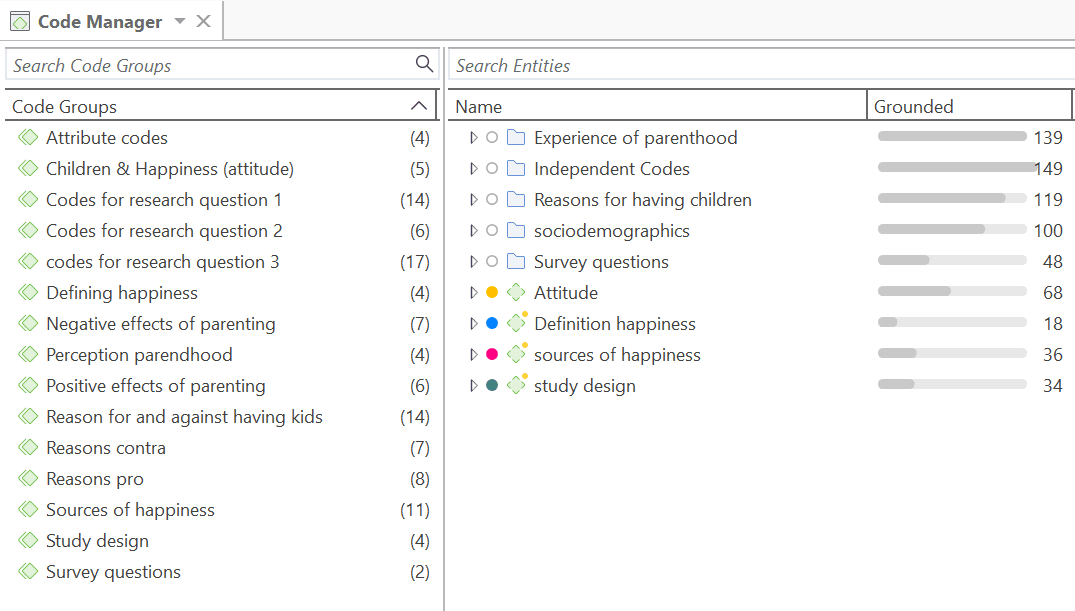 In the second screenshot, the folders have been expanded, and you see the type of categories which were sorted into the various folders.
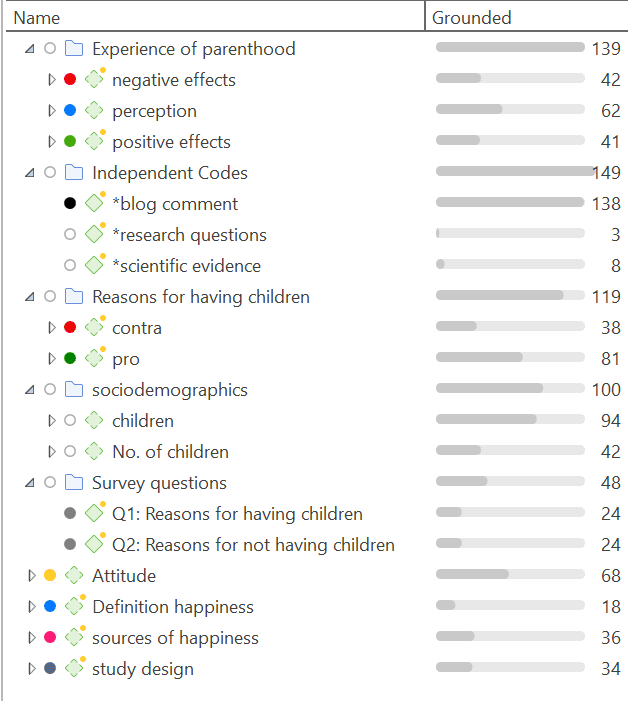
If you have interview transcripts and want to "code" for respondent attributes like gender, age, family status and the like, you need to use document groups. You only code for sociodemographic characteristics if there are multiple respondents in one document as for instance is the case with focus group data.
In the third screenshot, some categories have been expanded, and you see the subcodes. In previous versions of ATLAS.ti it was useful to use the same colour for all codes of a category. Given the new visualizations tools, e.g., in the Document and Code Manager, it can be useful to give each subcode a different color as shown for the category 'sources of happiness'.
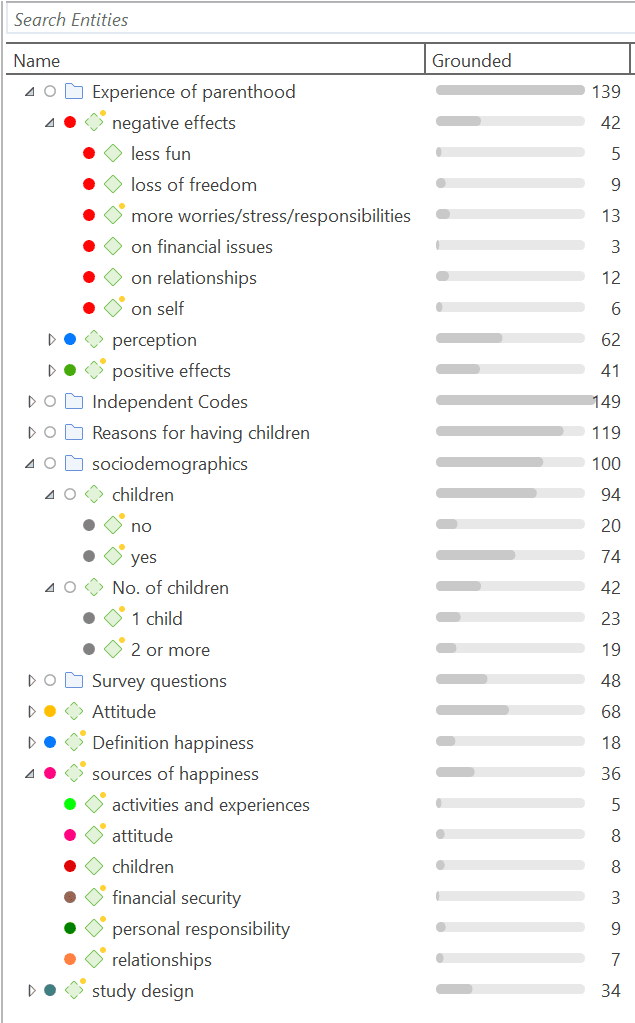
Characteristics of a well-structured code list
- Each code is distinct, its meaning is different from the meaning of any other code.
- The meaning of each code is described in the code comment.
- Each category can be clearly distinguished from other categories.
- All subcodes that belong to a category are similar as they represent the same kind of thing. Nonetheless, each sub code within a category is distinct.
- Each code appears only once in the code system.
- The code system is a-theoretical. This means the code system itself does not represent a model nor a theory. The codes merely describe the data, so that the data can easily be accessed through them.
- The code system should be logical, so you can find what you are looking for.
- The code system contains between 10 and 25 top-level categories.
- The code system is no more than two to three levels deep. Thus, it consists of folders, categories and their subcodes. If there are layers of meaning in a section of your data, it is better to create separate codes and double-code the data. This way you can later associate those layers of meaning, e.g., by using the Code Co-occurrence Table.
Good Practice Tips
Organize your code structure based on conceptual similarities, not observed or theoretical associations, nor according to how you think your will want to write the result chapters.
Use a separate code for each element of what the text is about, i.e., each code should encompass one concept only. If there are multiple aspects, the passage can be coded with multiple codes.
Don't worry if not all of your codes can be sorted into a category. Some codes will remain single codes. In order not to "loose" them collect them in a folder, so they show up in their own section in the code system.
The Role of Code Groups in Building a Code System
If you have a lot of low frequency codes that you want or need to merge, then code groups are a good way to collect them. After you have added all low level codes that belong to the same theme / topic / idea, you can set this code group as filter. This makes it easier to merge the codes. The next most likely step is to create a category and add the merged codes as subcodes. You may want to keep the code group because it will come in handy later in the analysis as filter.
Moving on
Once the data is coded, you have a good overview of your material and can describe it. You can then take the analysis a step further by querying the data. The tools that can be used include the code co-occurrence table, the code document table, the query tool, and the networks.
The goal is to delve deeper into the data and find relationships and patterns. Writing memos is very important at this stage as much of the analysis does not just happen because you apply a tool. The insights come when reading the data resulting from a query, and when writing summaries and interpretations.
Literature
The recommendations in this section are based on the following authors:
Bazeley, Pat (2013). Qualitative Data Analysis: Practical Strategies. London: Sage.
Bernard, Russel H. and Ryan, Gery W. (2010). Analysing Qualitative Data: Systematic Approaches. London: SAGE Publications.
Bodgan, R., and Biklen, S.K. (1992). Qualitative Research for education: An introduction to theory and methods (2nd ed.). Boston: Allyn & Bacon.
Charmaz, Kathy (2006/2014). Constructing Grounded Theory: A Practical Guide Through Qualitative Analysis. London: SAGE Publications.
Corbin, Juliet and Strauss, Anselm (2008/2015, 3rd and 4th ed.). Basics of Qualitative Research: Techniques and Procedures for Developing Grounded Theory. Thousand Oaks, CA: SAGE Publications.
Freeman, Melissa (2017). Modes of Thinking for Qualitative Data Analysis. NY: Routledge.
Friese, Susanne (2019). Qualitative Data Analysis with ATLAS.ti. London: Sage.
Gibbs, G. (2008). Analysing Qualitative Data. London: SAGE.
Guest, G., MacQueen, K.M., and Namey, E.E. (2012). Applied Thematic Analysis. Los Angeles: SAGE Publications.
Guest, G., Kathleen M. MacQueen, and Emily E. Namey (2012). Applied Thematic Analysis. Los Angeles: Sage.
Hammersley M., and Atkinson P. (2007) Ethnography: Principles in Practice. Third edition. London: Routledge.
Johnston, L. (2006). Software and method: Reflections on teaching and using QSR NVivo in doctoral research. International Journal of Social Research Methodology, 9(5), 379–391.
Lofland, J. (1971). Analyzing social settings: A guide to qualitative observation and analysis. CA: Wadsworth.
Miles, Matthew B., Huberman, M., and Saldaña, J. (2014, 3rd ed.). Qualitative Data Analysis. Thousand Oaks, CA: SAGE Publications.
Richards, L., and Morse, J.M. (2013, 3rd ed). Readme first: for a user’s guide to Qualitative Methods. Los Angeles: Sage
Richards, L. (2021, 4ed). Handling qualitative data: A practical guide. London: SAGE Publications.
Saldaña, J. (2021). The Coding Manual for Qualitative Researchers. London: SAGE Publications.
Spradley, James P. (2016). The Ethnographic Interview. Waveland Press.
Strauss, A. (1987). Qualitative analysis for social scientists. Cambridge, UK: Cambridge University Press.
Weston, C., Gandell, T., Beauchamp, J., Beauchamp, C., McApline, L., and Wiseman, C. (2001). Analyzing Interview Data: The Development and Evolution of a Coding System, Qualitative Sociology, 24(3): 381-400.
Creating a Codebook
If you want to create a codebook for the appendix of a report, do not use the Export Codebook option that you find under the Import / Export tab. The purpose of this option is to transfer codebooks between projects or computers. The recommended option to create a code book is to use the Excel export option from the Code Manager:
Open the Code Manager and select Excel Export in the ribbon.
Select all options that you want to include. Essential options for a code book are codes and comments. You may also want to include groundedness, density and code groups.
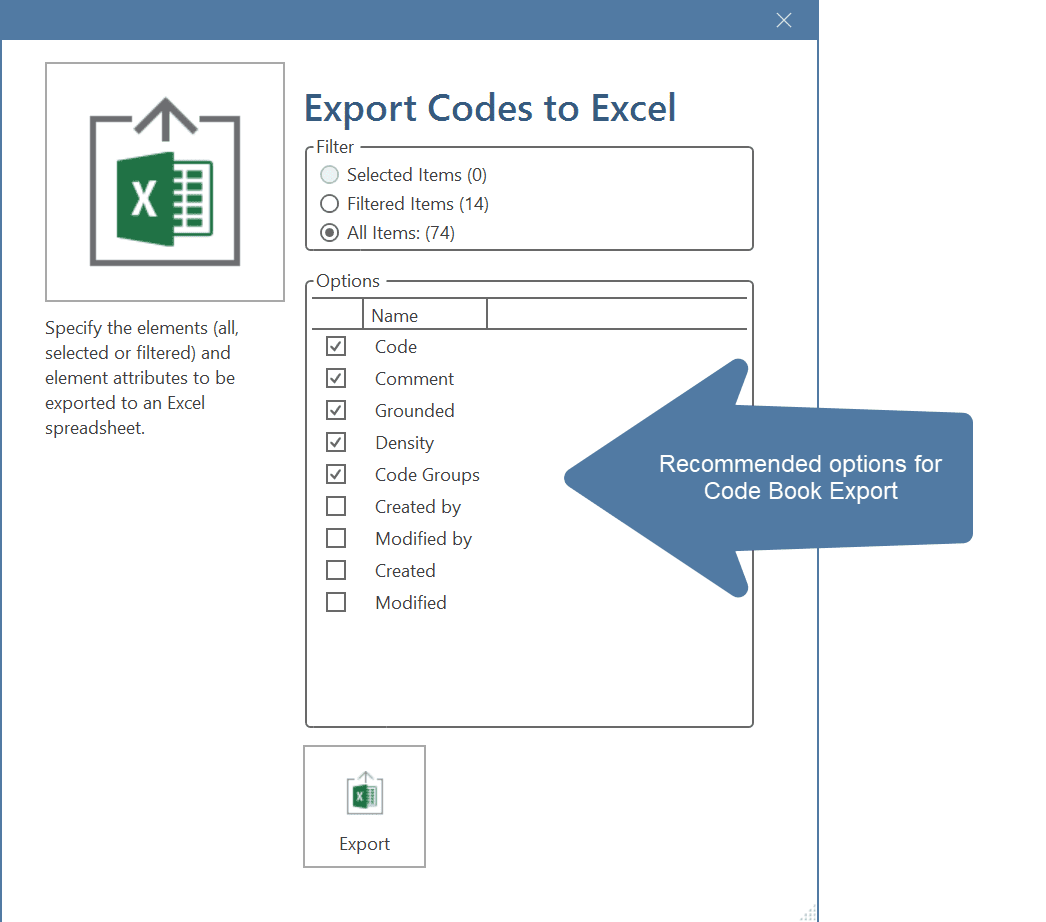
Example Outcome:
Folders and independent codes are listed in the first column, categories in the second column, and subcodes in the third column.
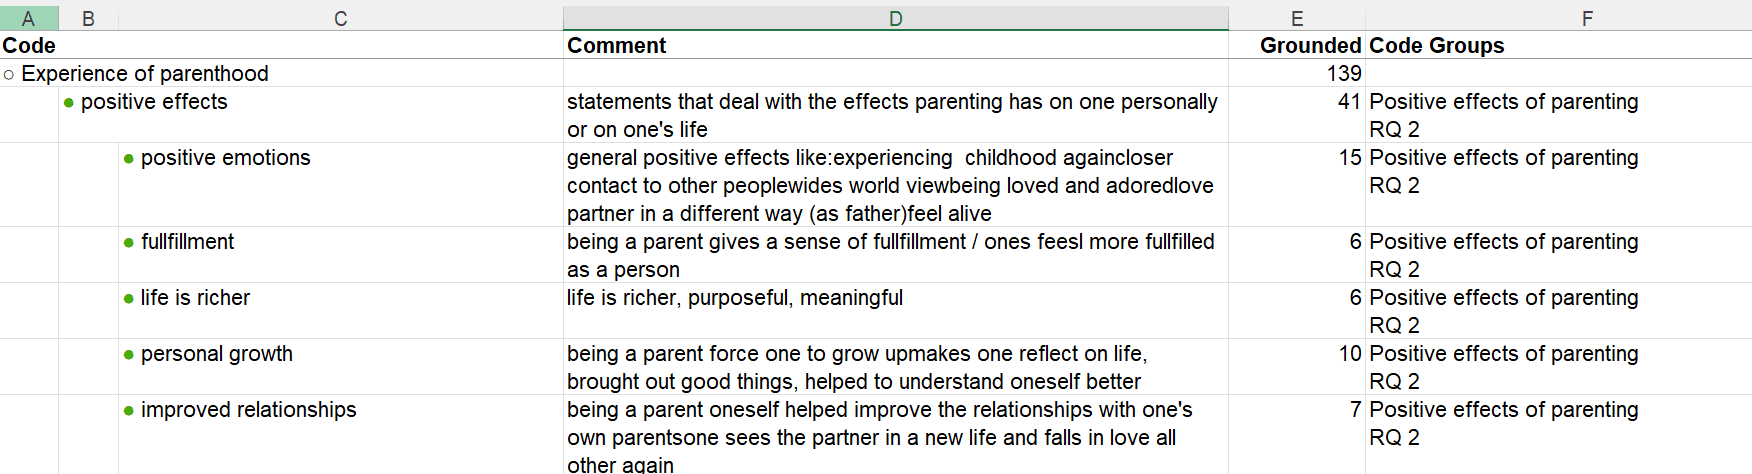
Working with Memos and Comments
Video Tutorial: Using memos at project begin.
"Memos and diagrams are more than just repositories of thoughts. They are working and living documents. When an analyst sits down to write a memo or do a diagram, a certain degree of analysis occurs. The very act of writing memos and doing diagrams forces the analyst to think about the data. And it is in thinking that analysis occurs" (Corbin & Strauss: 118).
"Writing is thinking. It is natural to believe that you need to be clear in your mind what you are trying to express first before you can write it down. However, most of the time, the opposite is true. You may think you have a clear idea, but it is only when you write it down that you can be certain that you do (or sadly, sometimes, that you do not)" (Gibbs, 2005).
The ideas captured in memos are often the pieces of a puzzle that are later put together in the phase of report writing.
Theory-building, often associated with building networks, also involves writing memos.
Memos in ATLAS.ti can be just a text on its own, or can be linked to other entities like quotations, codes, or other memos.
Differences between Memos and Comments
From a methodological point of view comments are also memos in the sense that comments are also places for thinking and writing.
In technical terms, in ATLAS.ti there is a distinction between comments and memos, as comments exclusively belong to one entity. For example, the document comment is part of the document; a code comment belongs to a particular code and is usually a definition for this code. A quotation comment contains notes or interpretations about the quotation it belongs to.
Comments are not displayed in browsers separately from the entity to which they are attached.
Quotation comment
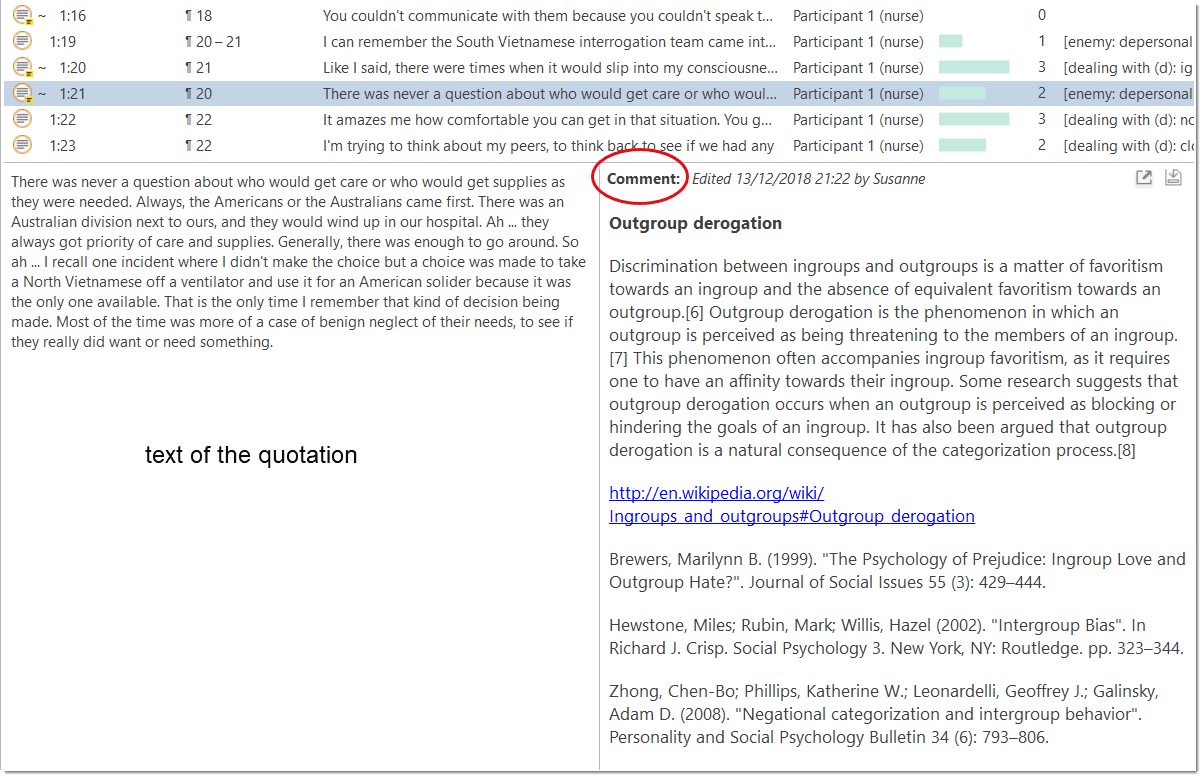
Code comment
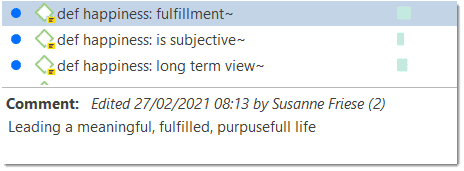
Memos
ATLAS.ti memos in comparison can be freestanding.
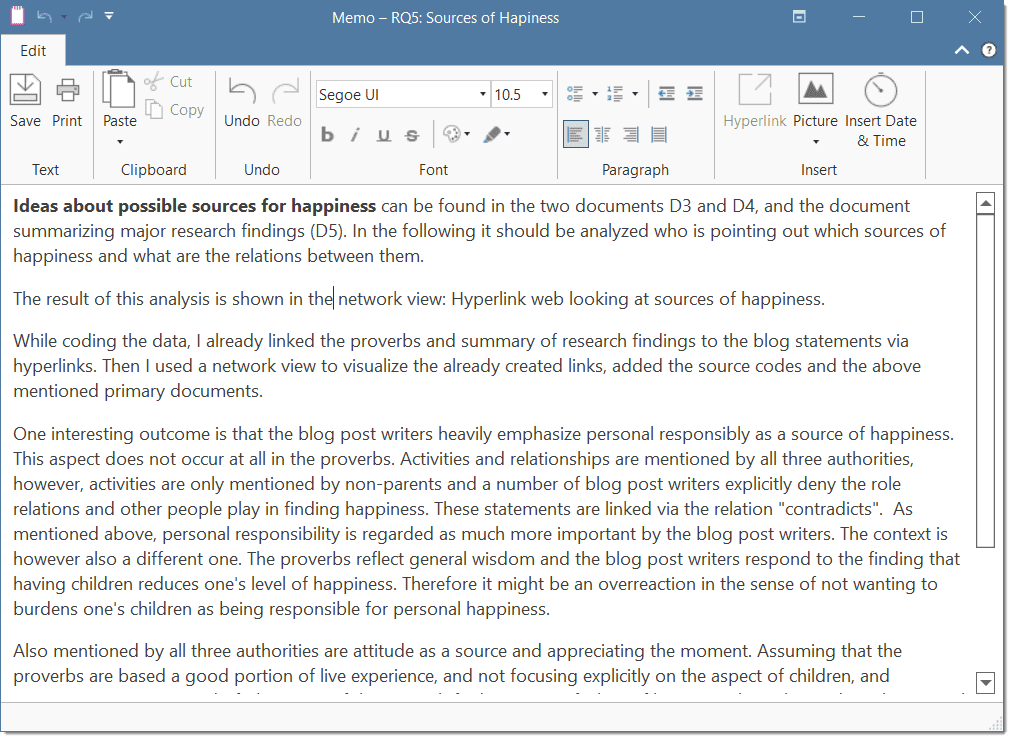
-
You can write a comment for a memo, for example: use this memo for section 2 in chapter 4 in my thesis.
-
They have a type attribute. This means you can label them as methodological memo, as theoretical memo, organizational memo, and the like.
-
Memos can be linked to quotations, codes and other memos (see Grounded and Density column in the Memo Manager).
-
Memos can be grouped.
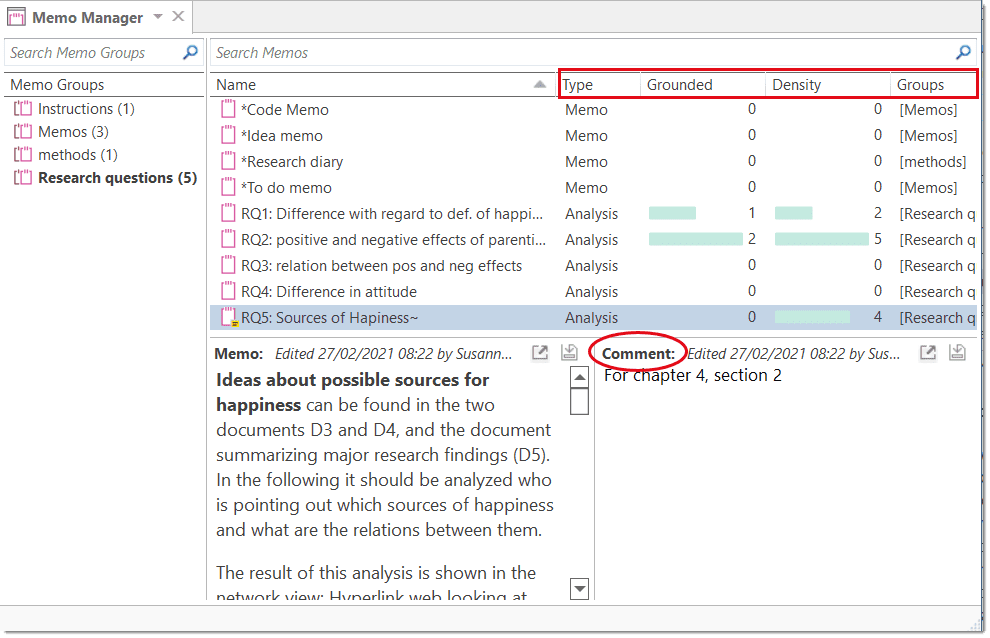
Creating Memos
Memos can be created from the Home tab, or in the Memo Manager.
To create a memo from the Home tab
click the drop-down menu for New Entities and select Free Memo.
Enter a name for the new memo and click Create.
Depending on your last settings, the memo editor may open as floating or docked window. If you want to change between floated and docked windows, see Interface Navigation,
To create a memo in the Memo Manager
Open the Memo Manager and select Create Free Memo in the ribbon.
Enter a name for the new memo and click Create.
Begin to write your memo. When you are done, click the Save button and close the window.
Linking Memos
Memos can be linked to quotations, codes and other memos. You can link memos per drag & drop basically anywhere in the program, or visually in networks. See Linking Nodes. Below a few examples are given.
Do not drop a memo onto a code in the margin area. This action will replace the code with the memo, which in most cases is not the wanted outcome.
Reviewing Quotations Linked to a Memo
To review all quotations linked to a memo, hold down the Ctrl key + double-click. This opens the Quotation Reader, and you can read all quotations that you have linked to the memo.
Opening an Existing Memo
You can access memos from everywhere: the Project Explorer, the Memo Manager, in the margin area if you linked a memo to a quotation, or from within a network.
If you want to review or continue to work on a memo, just double-click the memo.
Writing a Comment
You find a field for writing comments in every Entity Manager.
To write a comment, select an item and type something in to the comment field. As soon as you select another item, the comment is automatically saved.
Changes can also explicitly be saved by clicking on the Save icon int the top right of the text pane.
All items that have a comment display a yellow post-it within their icon.
If you want to add formatting,
click on the icon with the arrow in the top right-hand corner. This opens a text editor that offers a number of formatting option. Alternatively, you can right-click on any entity and select the Edit Comment option from the context menu and write a comment for the selected entity.
References
Corbin, Juliet and Strauss, Anselm (2008). Basics of Qualitative Research: Techniques and Procedures for Developing Grounded Theory (3rd and 4th ed.). Thousand Oaks, CA: Sage.
Gibbs, Graham (2005). Writing as analysis. Online QDA.
Querying Data
ATLAS.ti offers several tools that support you in querying your data:
Simple Boolean Retrieval.
Code Document Table
The Code Document Table is a cross-tabulation of codes or code groups by documents or document groups. It shows how often a code (codes of a code group) has (have) been applied to a document or document group. See Code Document Table.
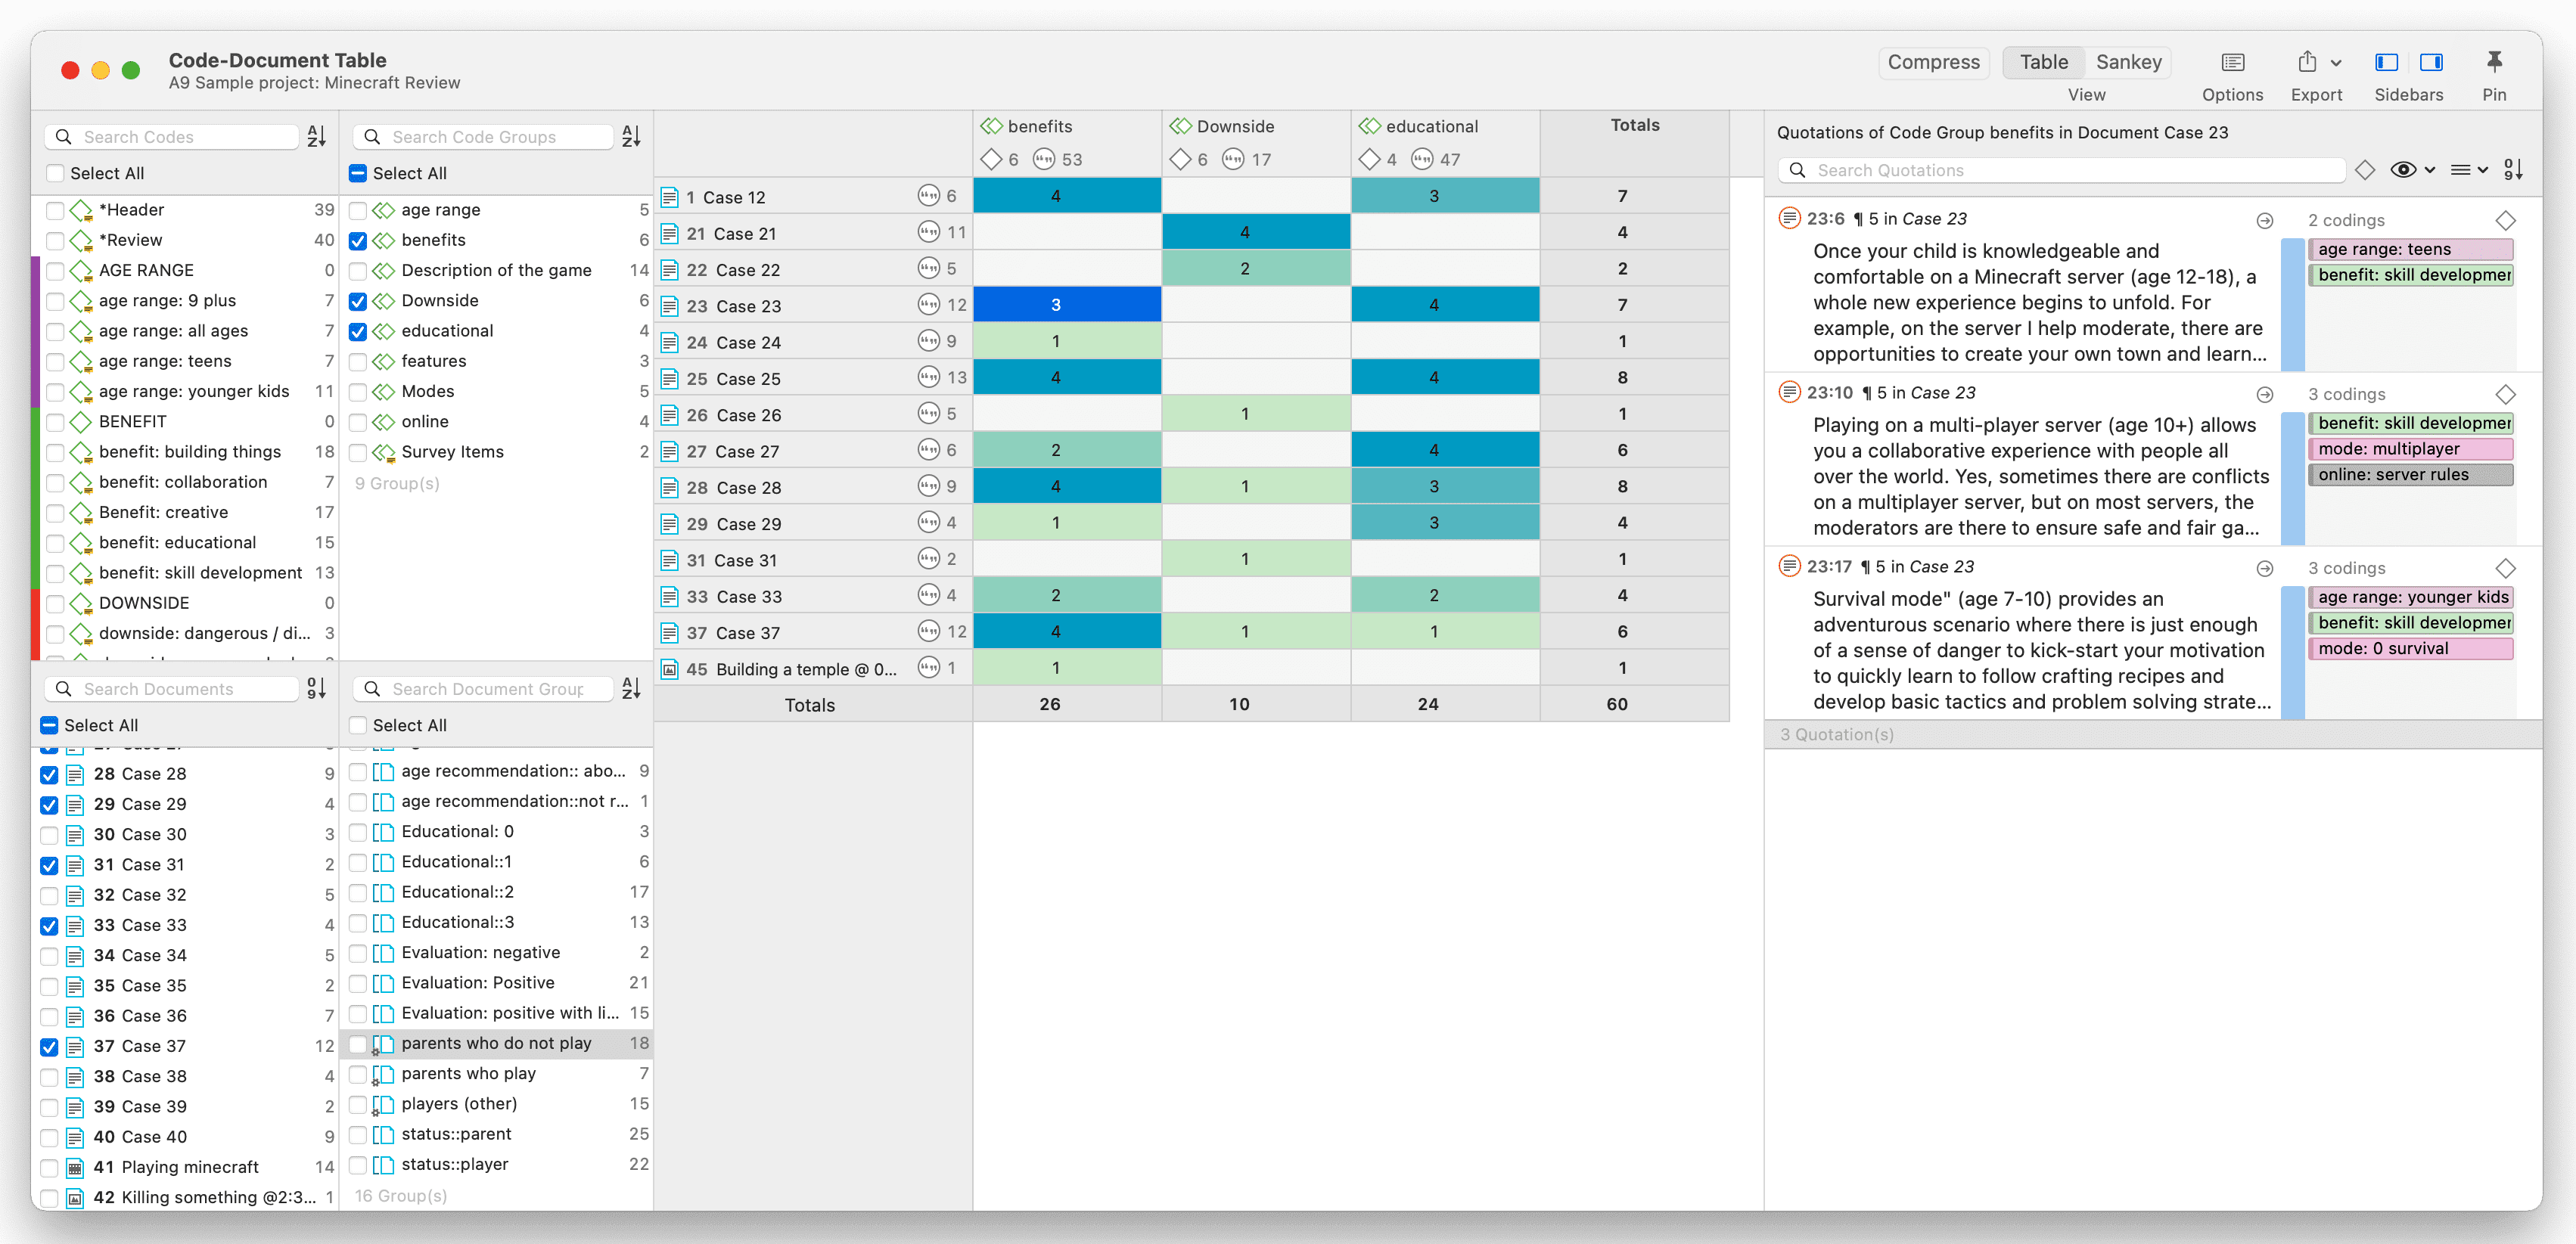
Co-occurrence Analysis
Use the Code Co-occurrence Explorer to explore coded data to get a quick overview where there might be interesting overlaps. If you are looking for specific co-occurrences and for accessing the quotations of co-occurring codes, the Code Co-occurrence Table is the better choice. See Code Co-Occurrence Table.
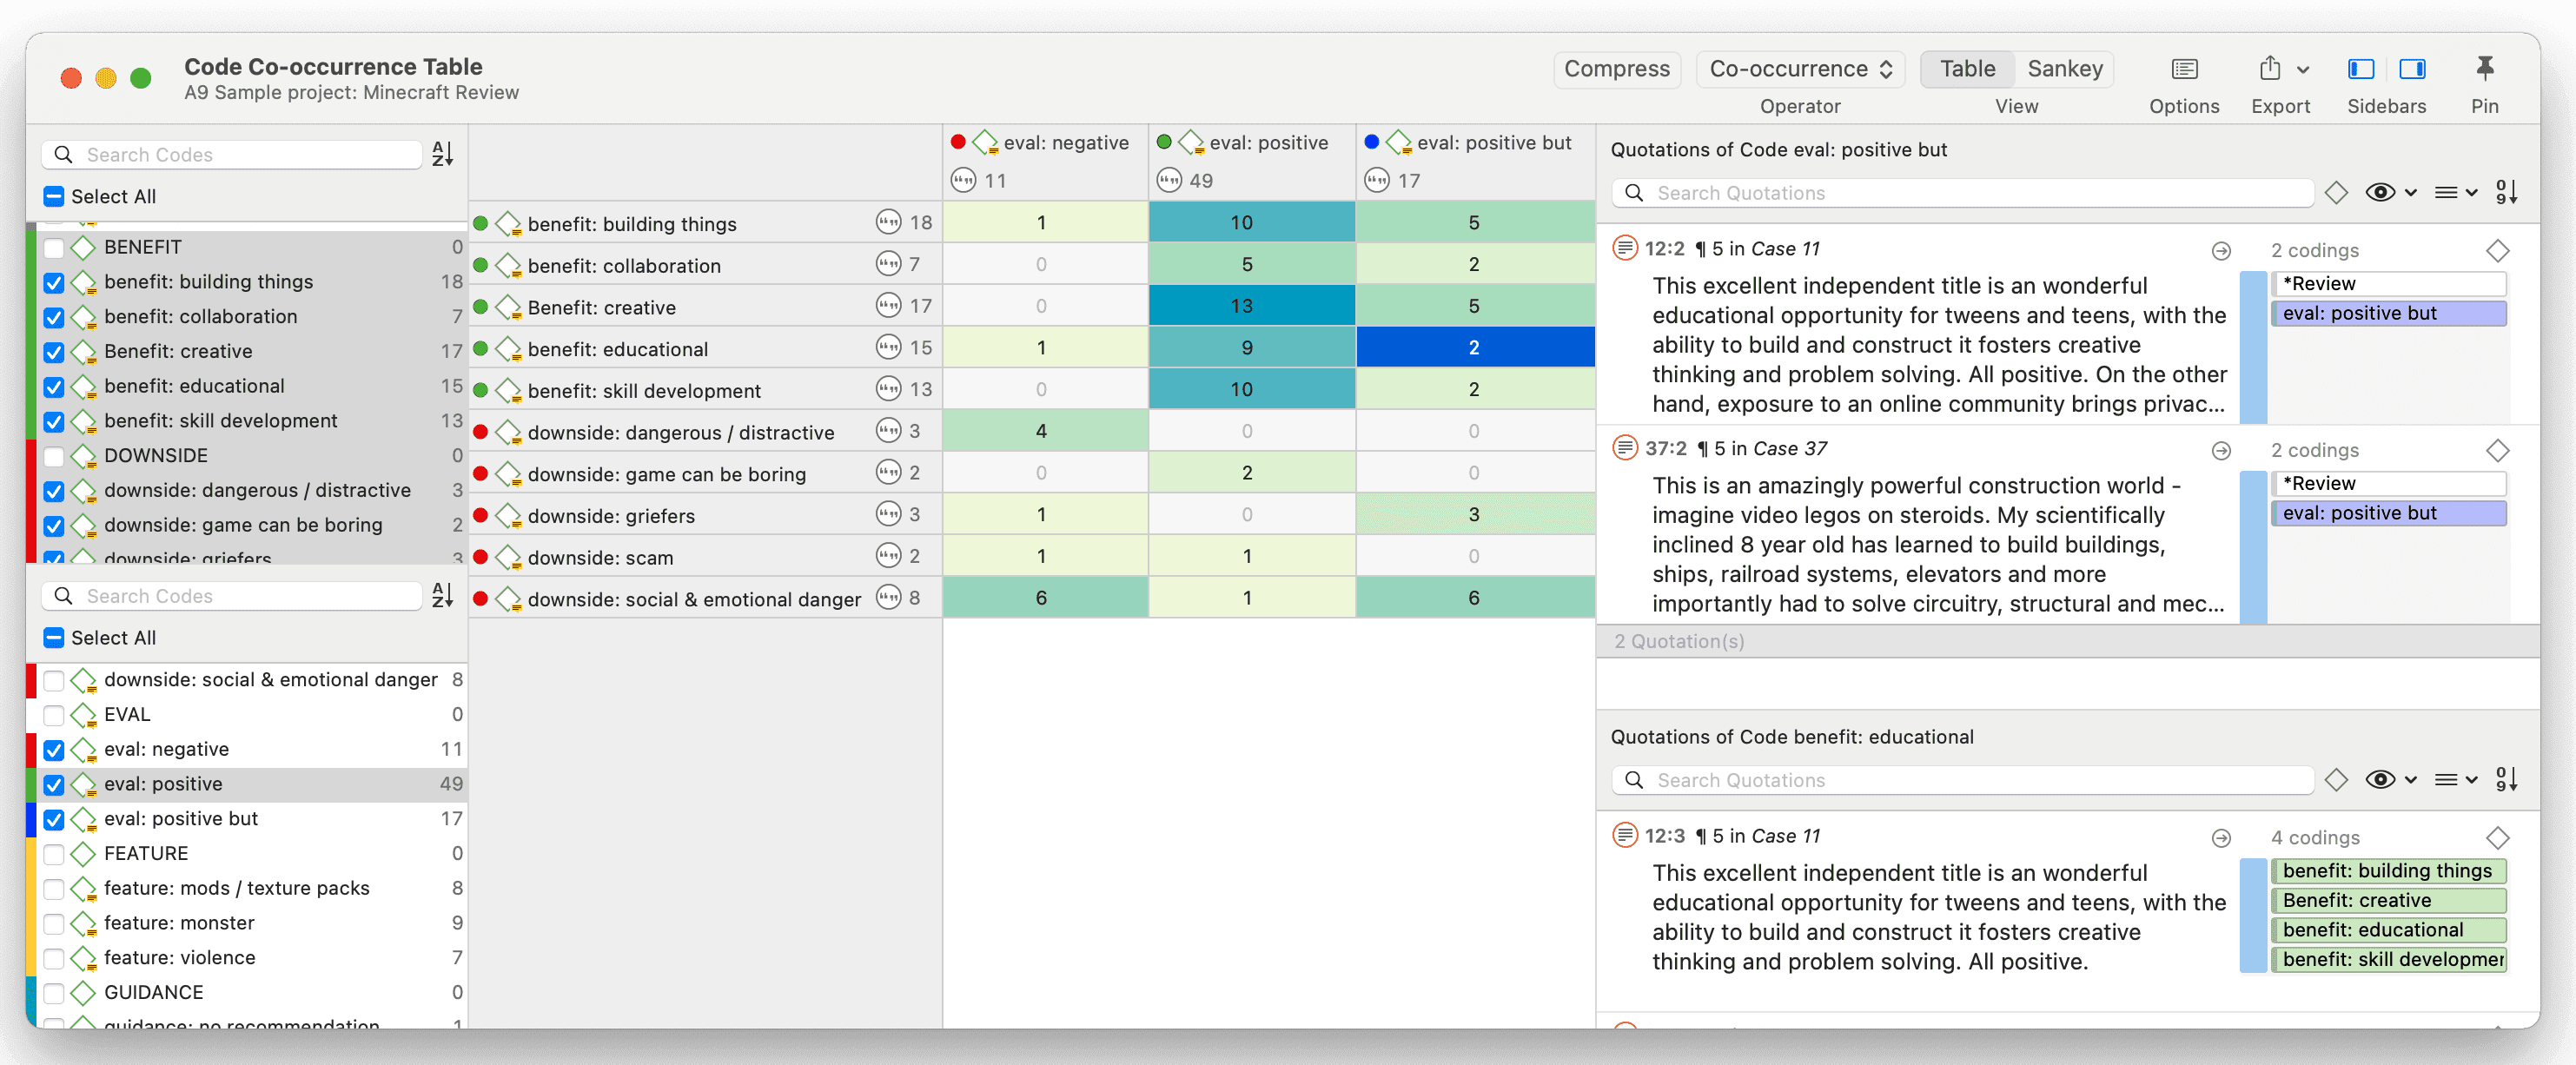
The Query Tool
The Query Tool finds quotations based on a combination of codes using Boolean, Proximity or Semantic operators. Example: Show me all quotations where both Code A and Code B have been applied.
Such queries can also be combined with variables in form of documents or document groups. This means that you can restrict a query to parts of your data like: Show me all quotations where both Code A and Code B have been applied, but only for female respondents between the age of 21 and 30. See the chapters on the Query Tool in the full manual.
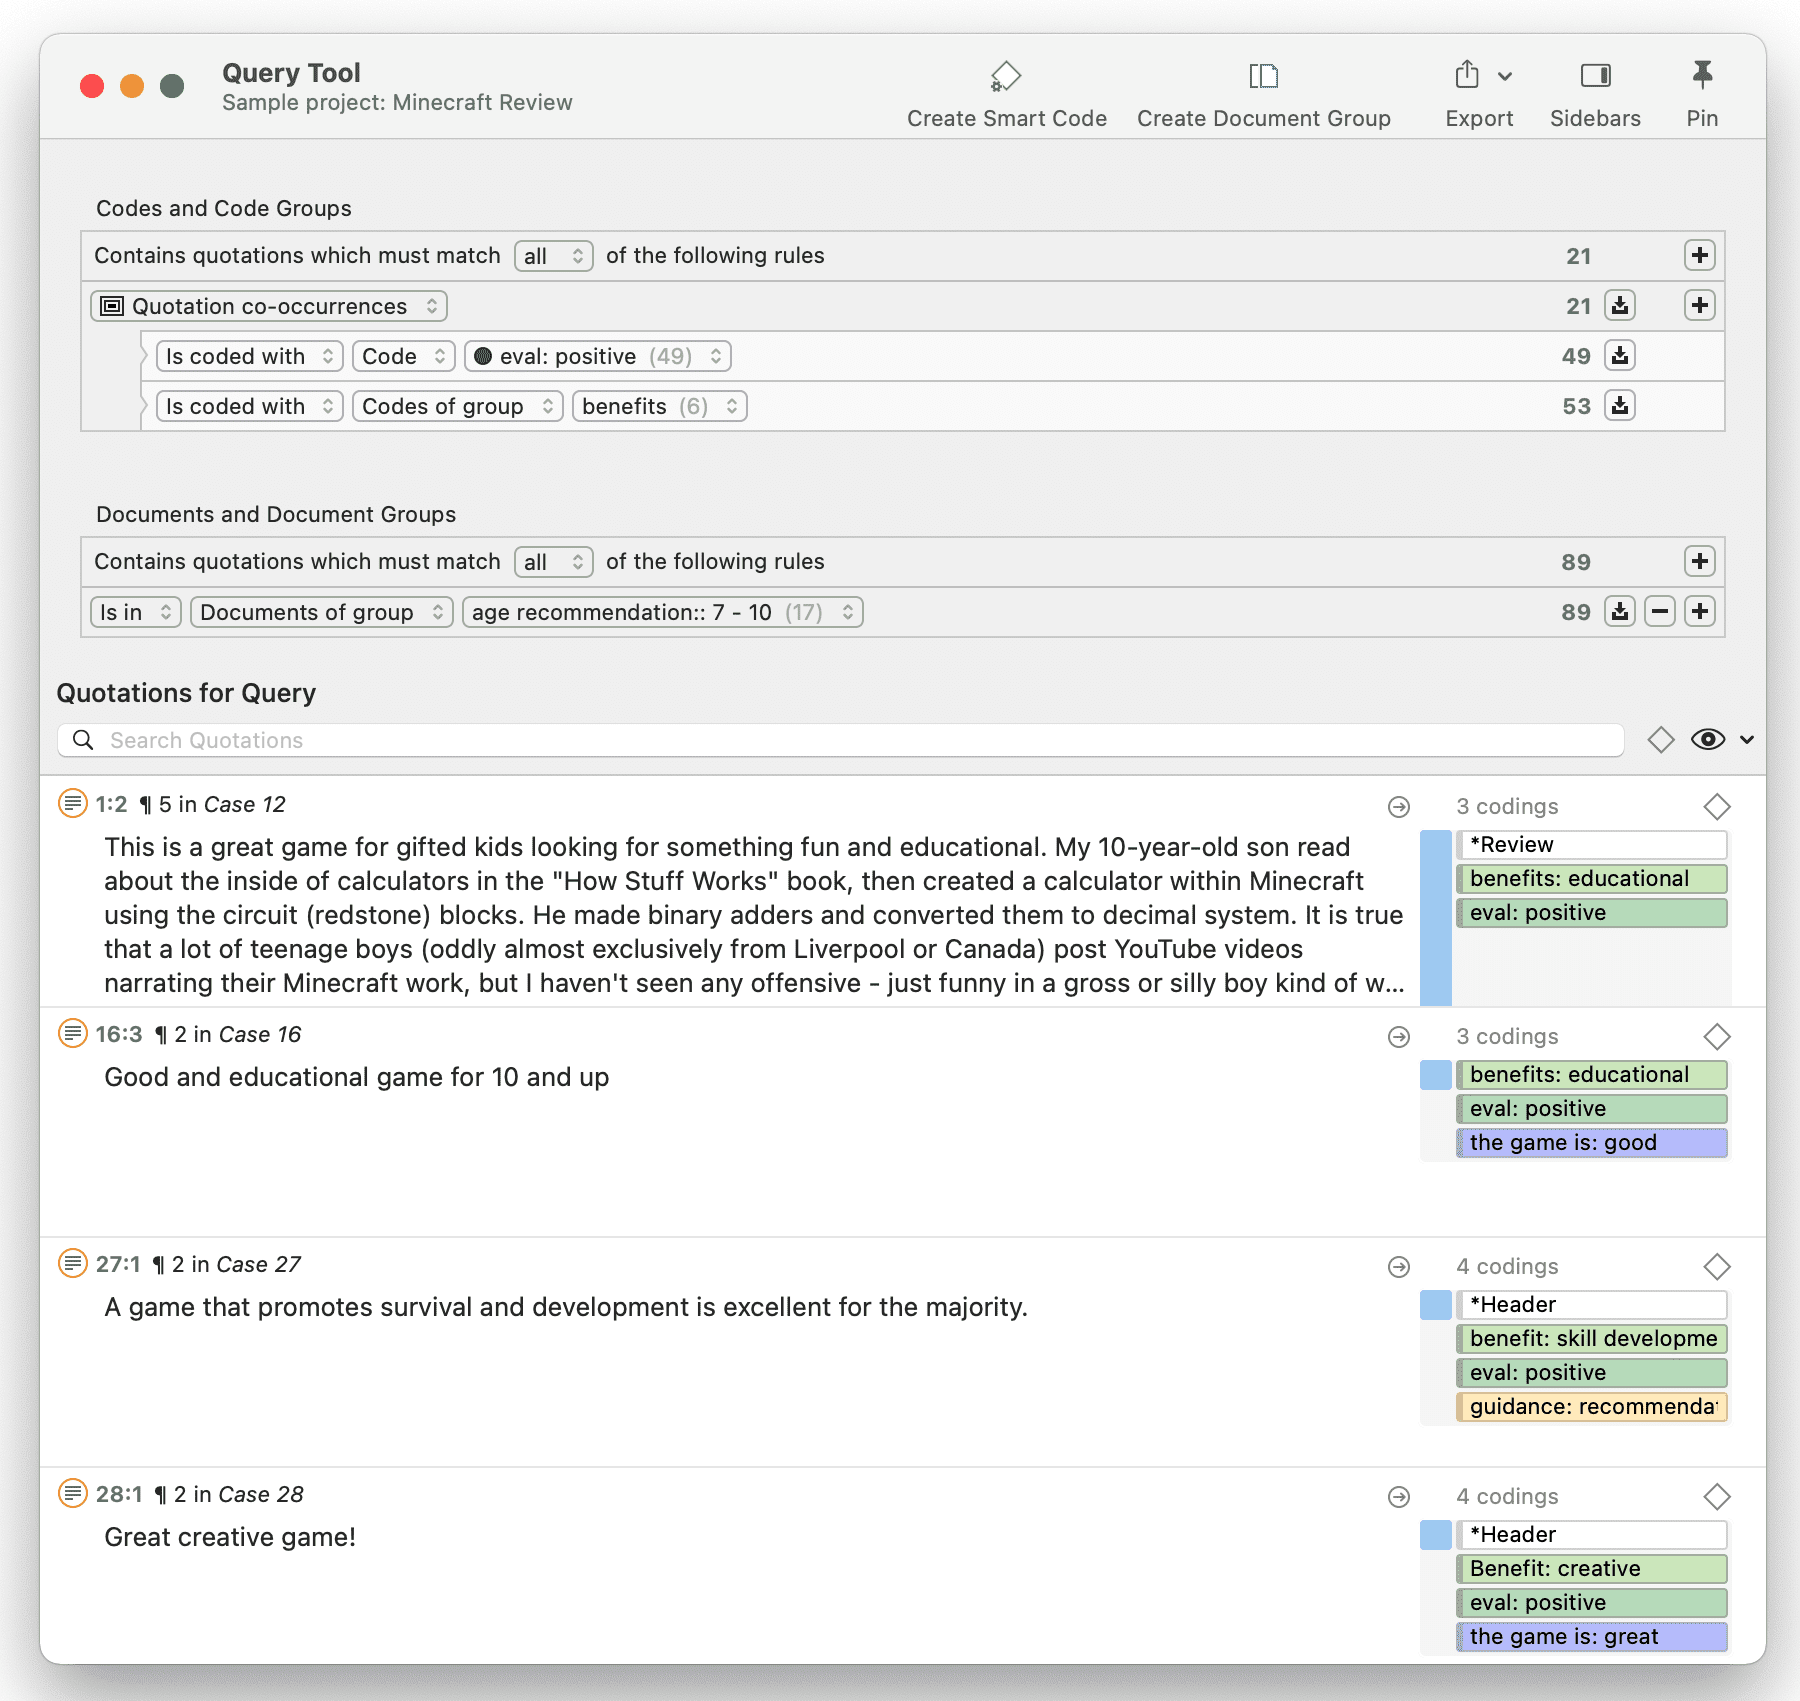
Smart Codes
Smart Codes are stored queries. They can be reused and always reflect the current state of coding, e.g. after more coding has been done or after coding has been modified. They can also be used as part of other query, thus, you can build complex queries step-by-step. See the chapter "Working With Smart Codes" in the full manual.
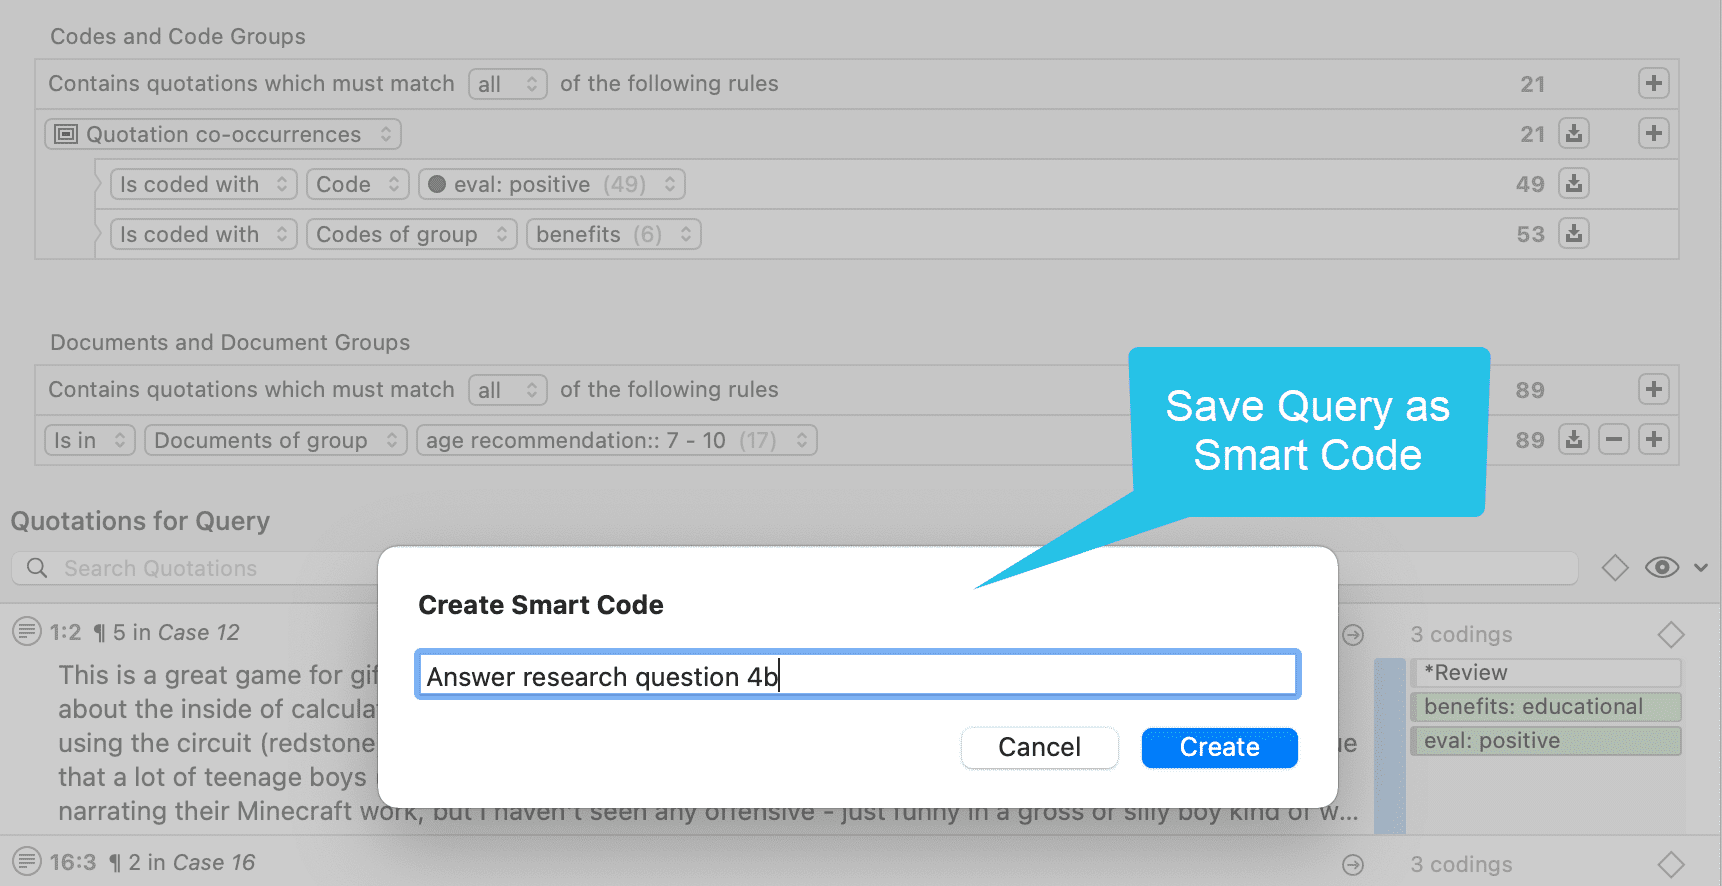
Smart Groups
Like smart codes, smart groups are stored queries based on groups. The purpose is to create groups on an aggregate level. For instance, if you have groups for gender, age and location, you can create smart groups that reflect a combination of these like all females from age group 1 living in city X. See the chapter "Working With Smart Groups" in the full manual.
Global Filters
Global filters allow you to restrict searches across the entire project. If you set a document group as global filter, the results in the Codes-Document or Code Co-occurrence Table will be calculated based on the data in the filter and not for the entire project. Global filters effect all tools, windows, and networks. See the chapter "Applying Global Filters For Data Analysis" on the full manual.
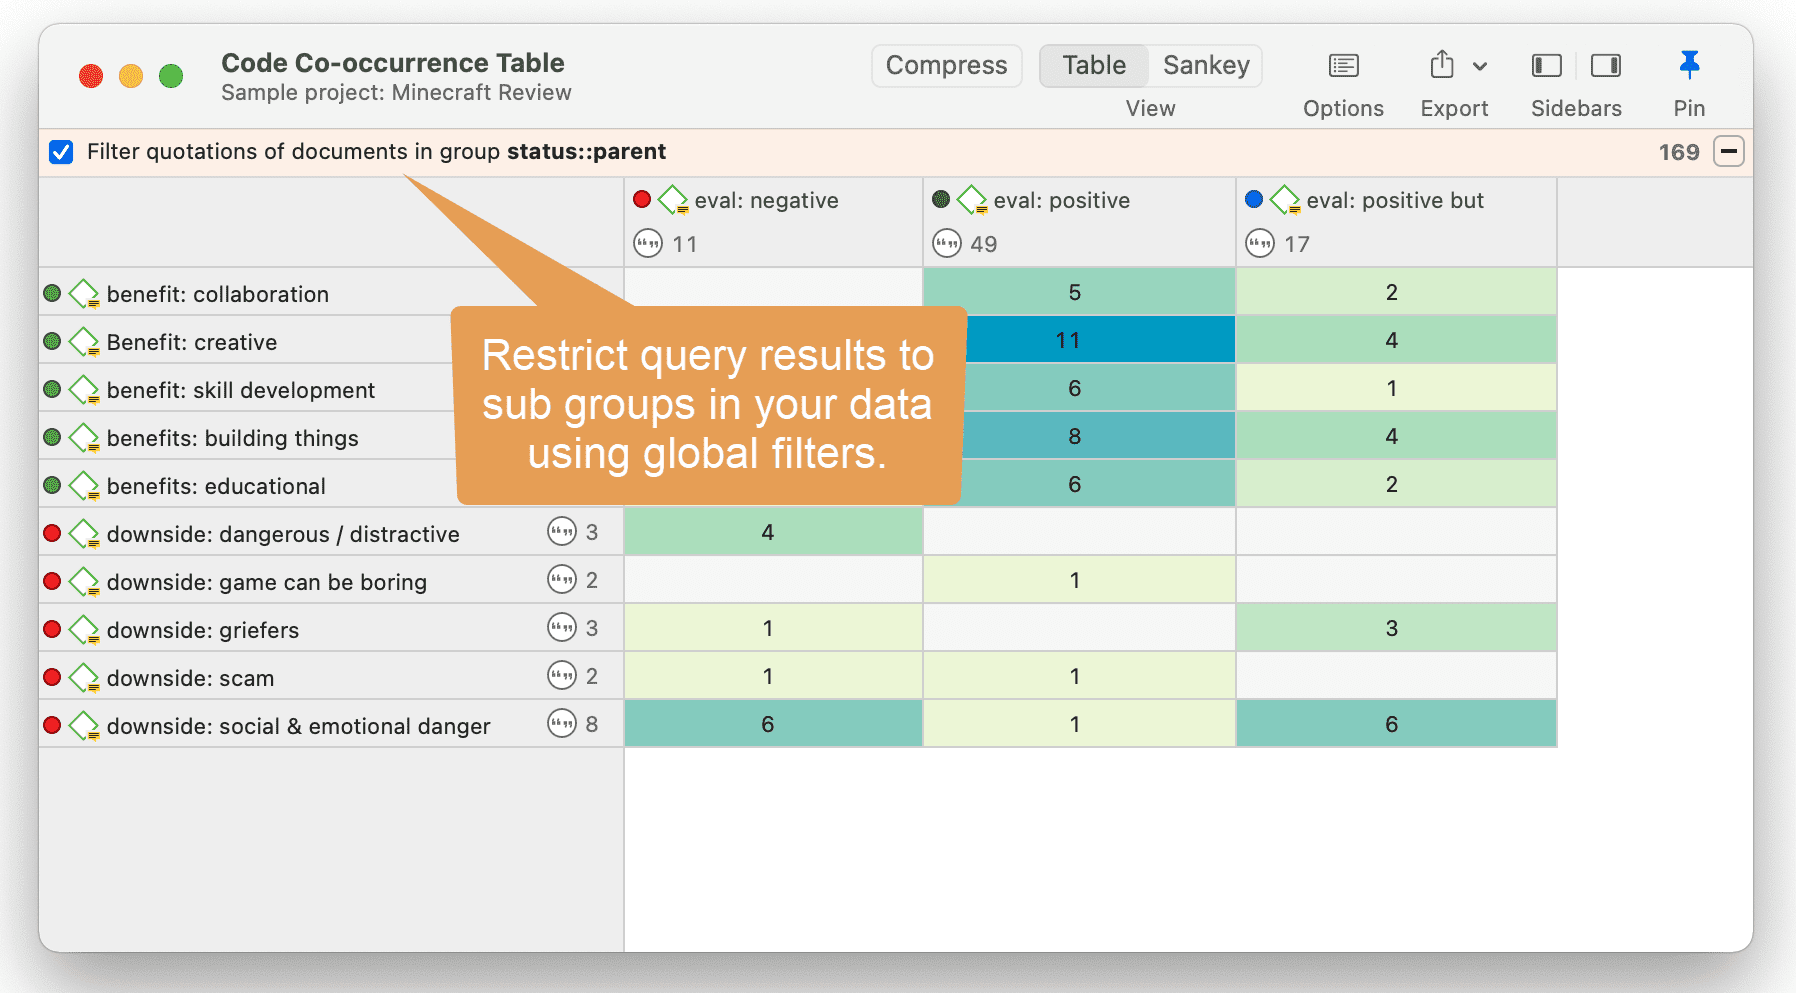
ATLAS.ti Networks
Video utorial: Visualizations in Building the Understanding
Visualization can be a key element in discovering connections between concepts, interpreting your findings, and effectively communicating your results. Networks in ATLAS.ti allow you to accomplish all three of these important objectives. These small segments of your larger web of analysis are modeled using the network editor, an intuitive work space we also like to think is easy on the eye.
The word network is a ubiquitous and powerful metaphor found in many fields of research and application. Flow charts in project planning, text graphs in hypertext systems, cognitive models of memory and knowledge representation (semantic networks) are all networks that serve to represent complex information by intuitively accessible graphic means. One of the most attractive properties of graphs is their intuitive graphical presentation, mostly in form of two-dimensional layouts of labeled nodes and links.
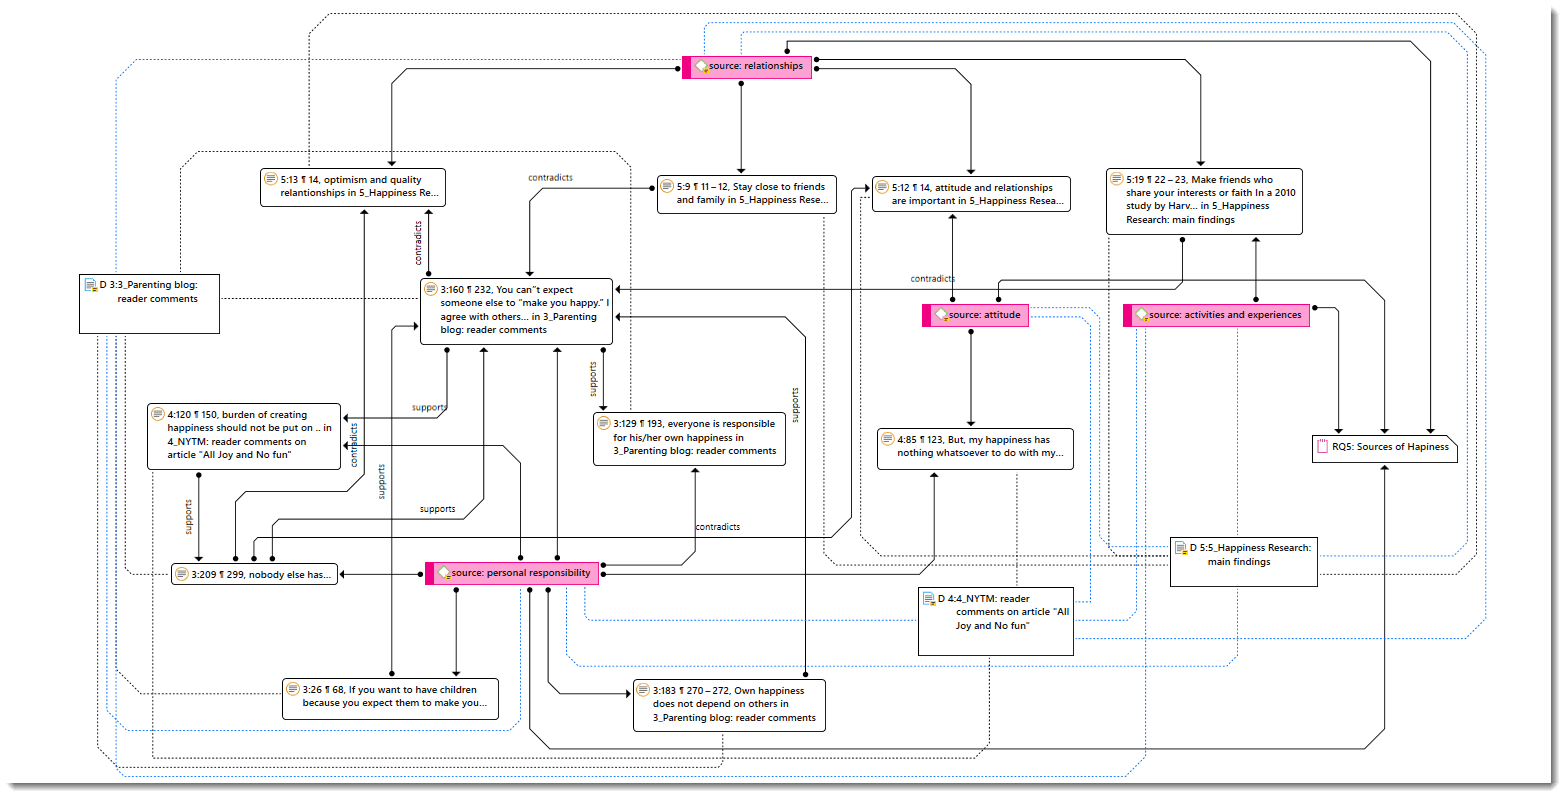 In contrast with linear, sequential representations (e.g., text), presentations of knowledge in networks resemble more closely the way human memory and thought is structured. Cognitive "load" in handling complex relationships is reduced with the aid of spatial representation techniques. ATLAS.ti uses networks to help represent and explore conceptual structures. Networks add a heuristic "right brain" approach to qualitative analysis.
The user can manipulate and display almost all entities of a project as nodes in a network: quotations, codes, code group, memos, memo groups, other networks, documents, document groups and all smart entities.
Basic Network Procedures
Two methods for creating networks are available. The first one creates an empty network, and you begin to add entities as sequential steps. The other method creates a network from a selected entity and its neighbors.
Creating a New Network
In the Home tab open the drop-down menu for New Entities and select New Networks.
Enter a name for the network and click Create. Another option is to open the Network Manager with a click on the Networks button and select New Network in the ribbon of the Network Manager.
Adding Nodes to a Network
You can add nodes via the option Add Nodes or via drag-and-drop.
Adding Nodes Using the Selection List
Select the Nodes tab in the ribbon and from there the Add Nodes button.
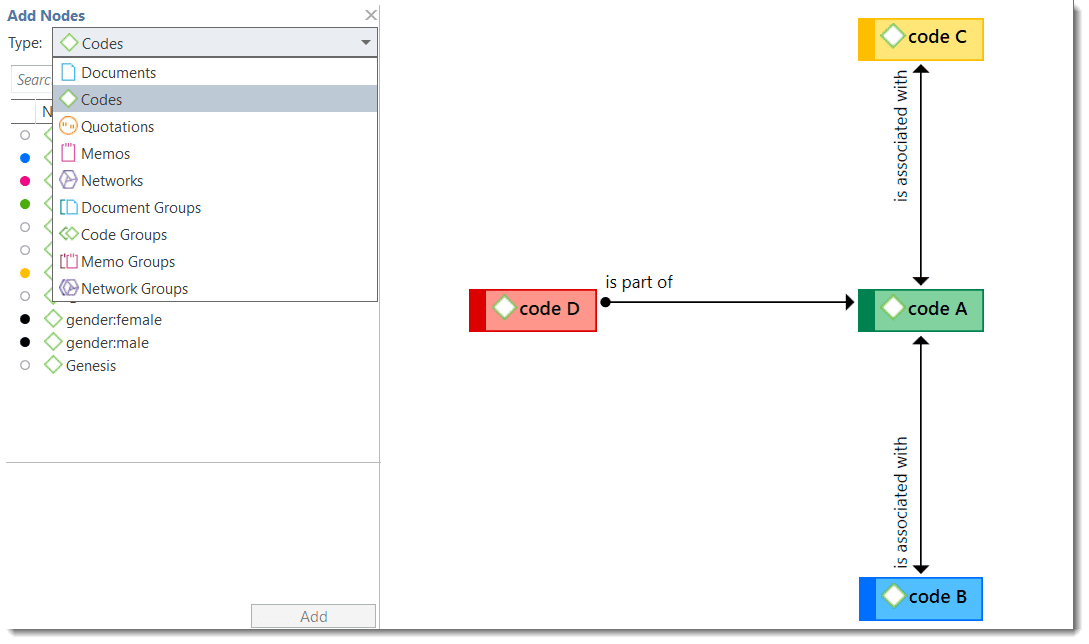
Adding Nodes Using the Selection List
Select the Nodes tab in the ribbon and from there the Add Nodes button.
This opens a selection list that is docked to the left-hand side of the network. At the bottom of the selection list you see the comments of an entity. Use the search fields to find entities faster.
Select the entity type and then the entities that you want to add to the network. Double-click to add the entity to a network; or drag-and-drop the selected entities to the network; or click on the Add button.
Adding Nodes via Drag & Drop
You can add nodes by dragging entities into the network editor from entity managers, group managers, the margin, the project explorer, or any of the browsers.
Open a network and position it for example next to the Project Explorer.
Select the node(s) you want to import into the network and drag-and-drop them into the editor.
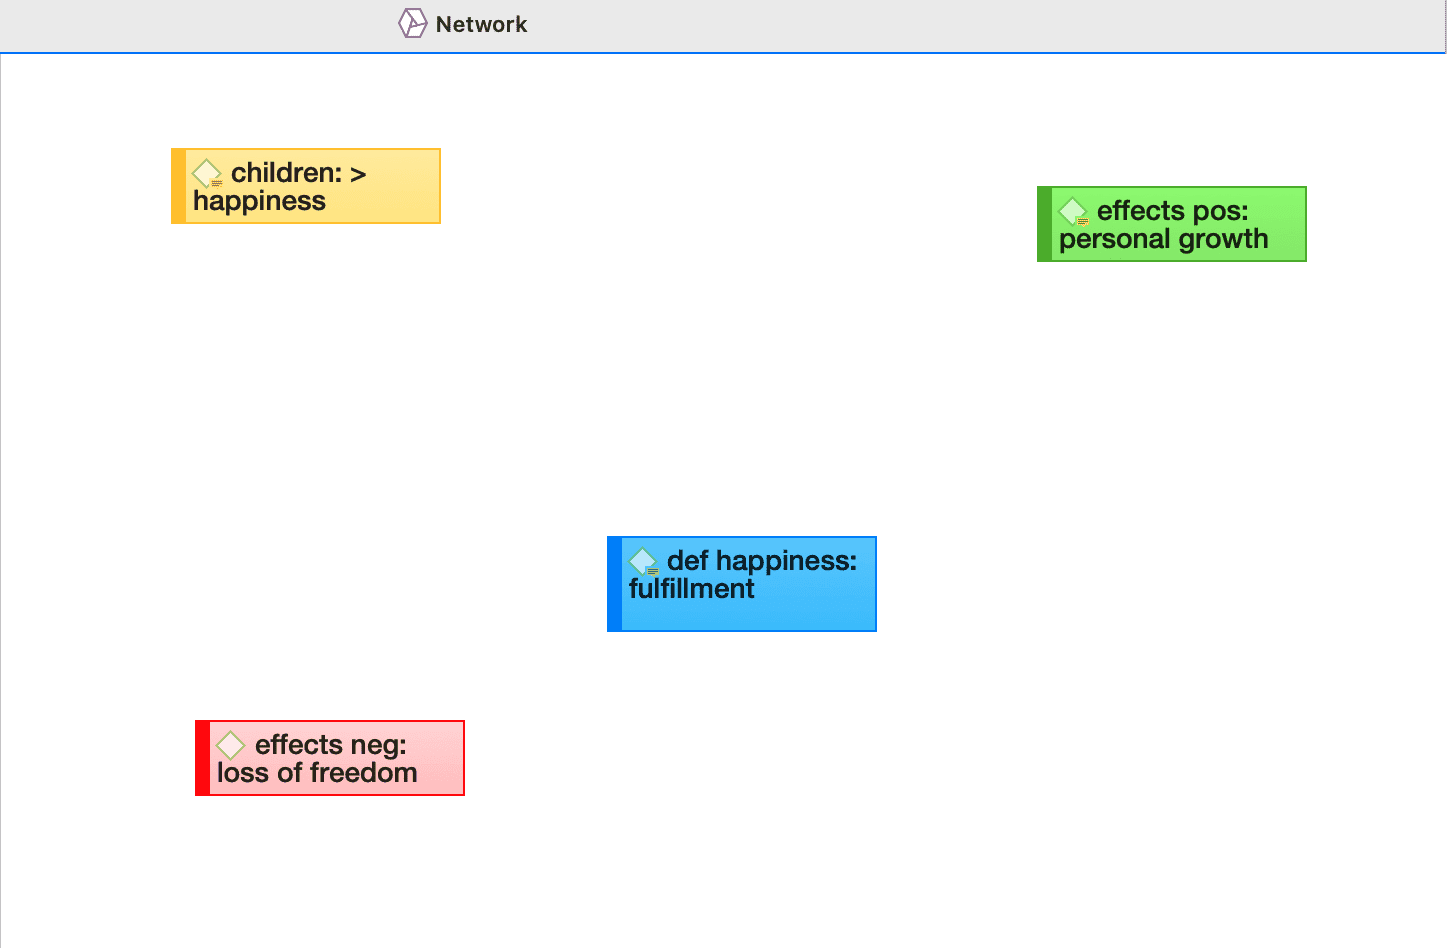
Selecting Nodes
Selecting nodes is an important first step for all subsequent operations targeted at individual entities within a network.
Selecting a Single Node
Move the mouse pointer over the node and left-click.
All previously selected nodes are deselected.
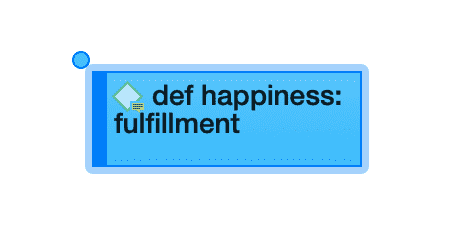
Selecting Multiple Nodes
Method 1
Hold down the Ctrl key on your keyboard, move the mouse pointer over the node and left click. Repeat this for every node you want to select.
Method 2
This method is very efficient if the nodes you want to select fit into an imaginary rectangle.
Move the mouse pointer above and left to one of the nodes to be selected. Hold down the left mouse button and drag the mouse pointer down and right to cover all nodes to be selected with the selection marquee. Release the mouse button.
Linking Nodes and Entities
There are several ways to link nodes:
Linking via Drag & Drop
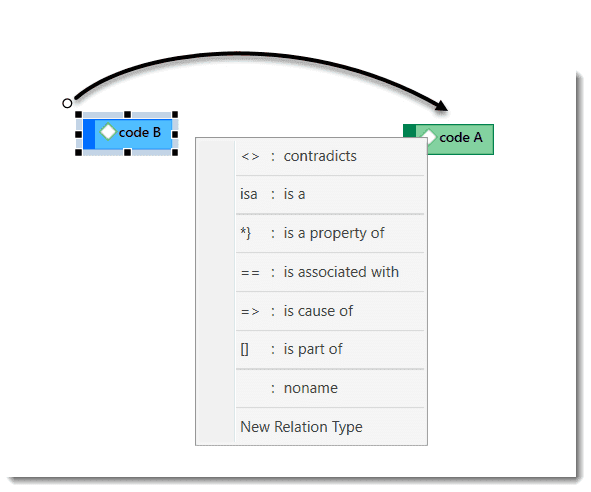
Select a node. A white dot appears in the top left corner of the node. Click on the white dot with the left mouse button and drag the mouse pointer to the node that you want to link.
Release the left mouse button on top of the node. If you link codes to codes or quotations to quotations, a list of relation opens. Select a relation.
The two nodes are now linked to each other. In case you linked two codes or two quotations to each other, the relation name is displayed above the line.
If none of the existing relations is suitable, select New Relation Type and create a new relation. The new relation will immediately be applied to the link.
Linking Two Nodes Using the Ribbon Icon

Select a node in a network and click on the Link button in the ribbon.
A black line appears. Move the end on top of another node and left-click.
If you link codes to codes or quotations to quotations, a list of relation opens. Select a relation.
You need to use the method for linking if you want to link more than two nodes at a time.
When you link two codes to each other, the Density counts goes up. For instance, if six source codes are linked to one target code, the density for the target code is 6; If the source codes have no other links, then their density count is 1. The density count for memos counts the connection to other memos and codes. If a memo is linked to two codes and one other memo, its density is 3.
Linking Three or More Nodes
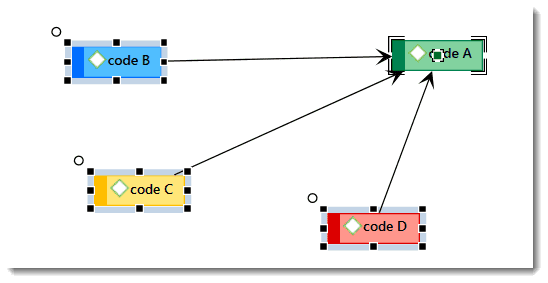
Select all nodes that you want to link to one other node. See Basis Network Procedures > Selecting Nodes for further information on how to select multiple nodes.
In the ribbon, click on the Link button. A black line appears. Move the end on top of the node you want the other nodes to be linked with and left-click. If you link codes to codes or quotations to quotations, a list of relation opens. Select a relation. Only one relation for all links can be selected.
Editing a Link
Move the mouse pointer to the line and left-click. The selected link label will be displayed boxed.
Right-click and open the context menu, or select the available options in the ribbon.
-
Open Network: opens a new network for the two nodes linked by this link.
-
Edit Comment: Use the comment field to explain why these two nodes are linked-
-
Flip Link: Use this option if you want to change the direction of a transitive or asymmetric link.
-
Cut Link: removes the link between the two nodes
-
Change Relation: Select a different relation from the list of available relations or create a new one and apply it.
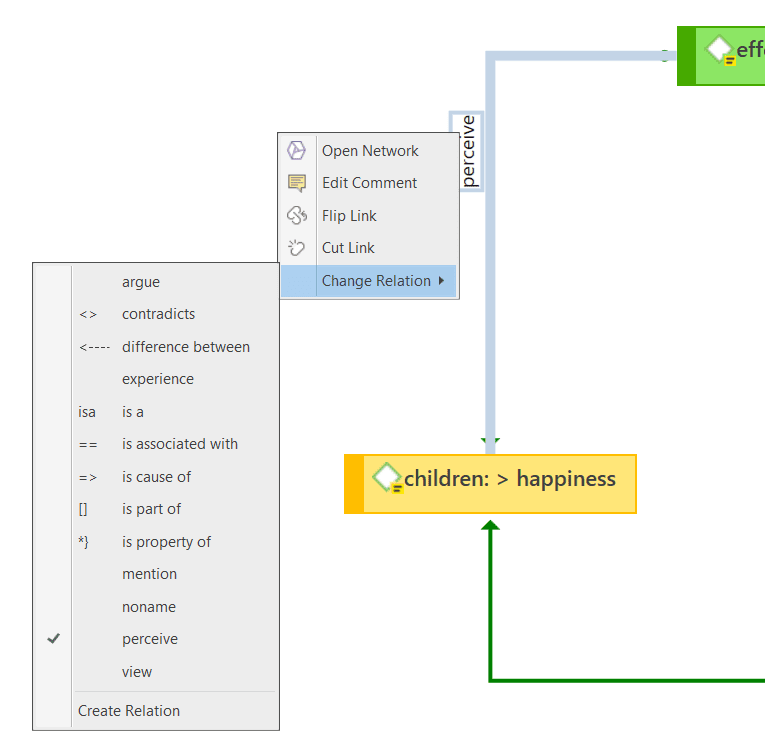
For second class links that do not have a name, only the cut link option is available.
Cutting Multiple Links

Select one or more nodes (= source) whose connections to another node (= target) you want to remove.
Click the Cut Links button in the ribbon and move the mouse pointer over the target node. If you do the target node is boxed, and the links to be cut are colored in orange. Click the left mouse button on the target node.
The links between nodes in a network are real connections between the entities. Therefore, creating and removing links should not be regarded as solely "cosmetic" operations. Links make permanent changes to the project.
Linking Codes to Codes, Quotations to Quotations, Memos to Memos in Managers and Browsers
Quotations, codes and memos can also be linked to each other in the Manager, the Project Explorer, or the respective entity browsers.
Select one or more source items in the list pane of the Manager, in the respective sub-branches of the Project Explorer, or in the entity browsers and drag them to the target item in the same pane.
Select a relation from the list of relations in case you link two codes or two quotations, or select New Relation Type and create a new relation.
Linking Entities of Different Types
When you code your data reading through a document, listening to audio data, viewing an image or video file, you are linking codes to quotations. This can also be done via drag & drop from the Project Explorer or any of the entity browsers to the list of codes or quotations in a manager.
This also applies to linking memos to codes, or memos to quotations.
Creating Reports
You can export data in spreadsheet format or as text reports (Word or PDF format).
Export as Spreadsheet
In every manager, you find a button (the rectangular icon with an up arrow) to export the content as spreadsheet. The export is a WYSIWYG (what you see is what you get) type of report. All columns currently displayed are exported.
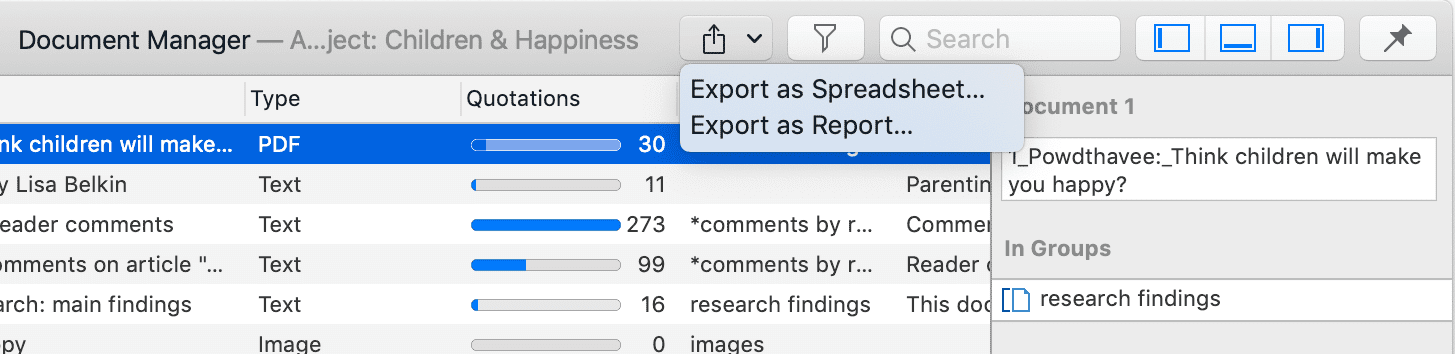
From Managers
To exclude a column from the report, click on the column header and deselect it.
To create a report, open the drop-down menu of the report button in the toolbar and select Export as Spreadsheet.
Use the grouping options to create different sheets for each of the selected entity, e.g. if you group a quotation report by codes, ATLAS.ti creates a separate sheet for each code and its quotation in the spreadsheet or Excel file.
From the Quotation Reader
To export the quotations listed in a Quotation Reader as spreadsheet, open the drop-down of the options button in the toolbar and select Export as Spreadsheet. The content of the report is the same as from the Quotation Manager. It contains all columns from the Quotation Manager.
From the Query Tool
To create a report, open the drop-down menu of the report button in the toolbar and select Export as Spreadsheet.
Export as Report
When using this option, you get a report in text or PDF format. It is available form all managers and the query tool. The report is configurable, this means you can select what it should contain. Before you create the report, you see a preview.
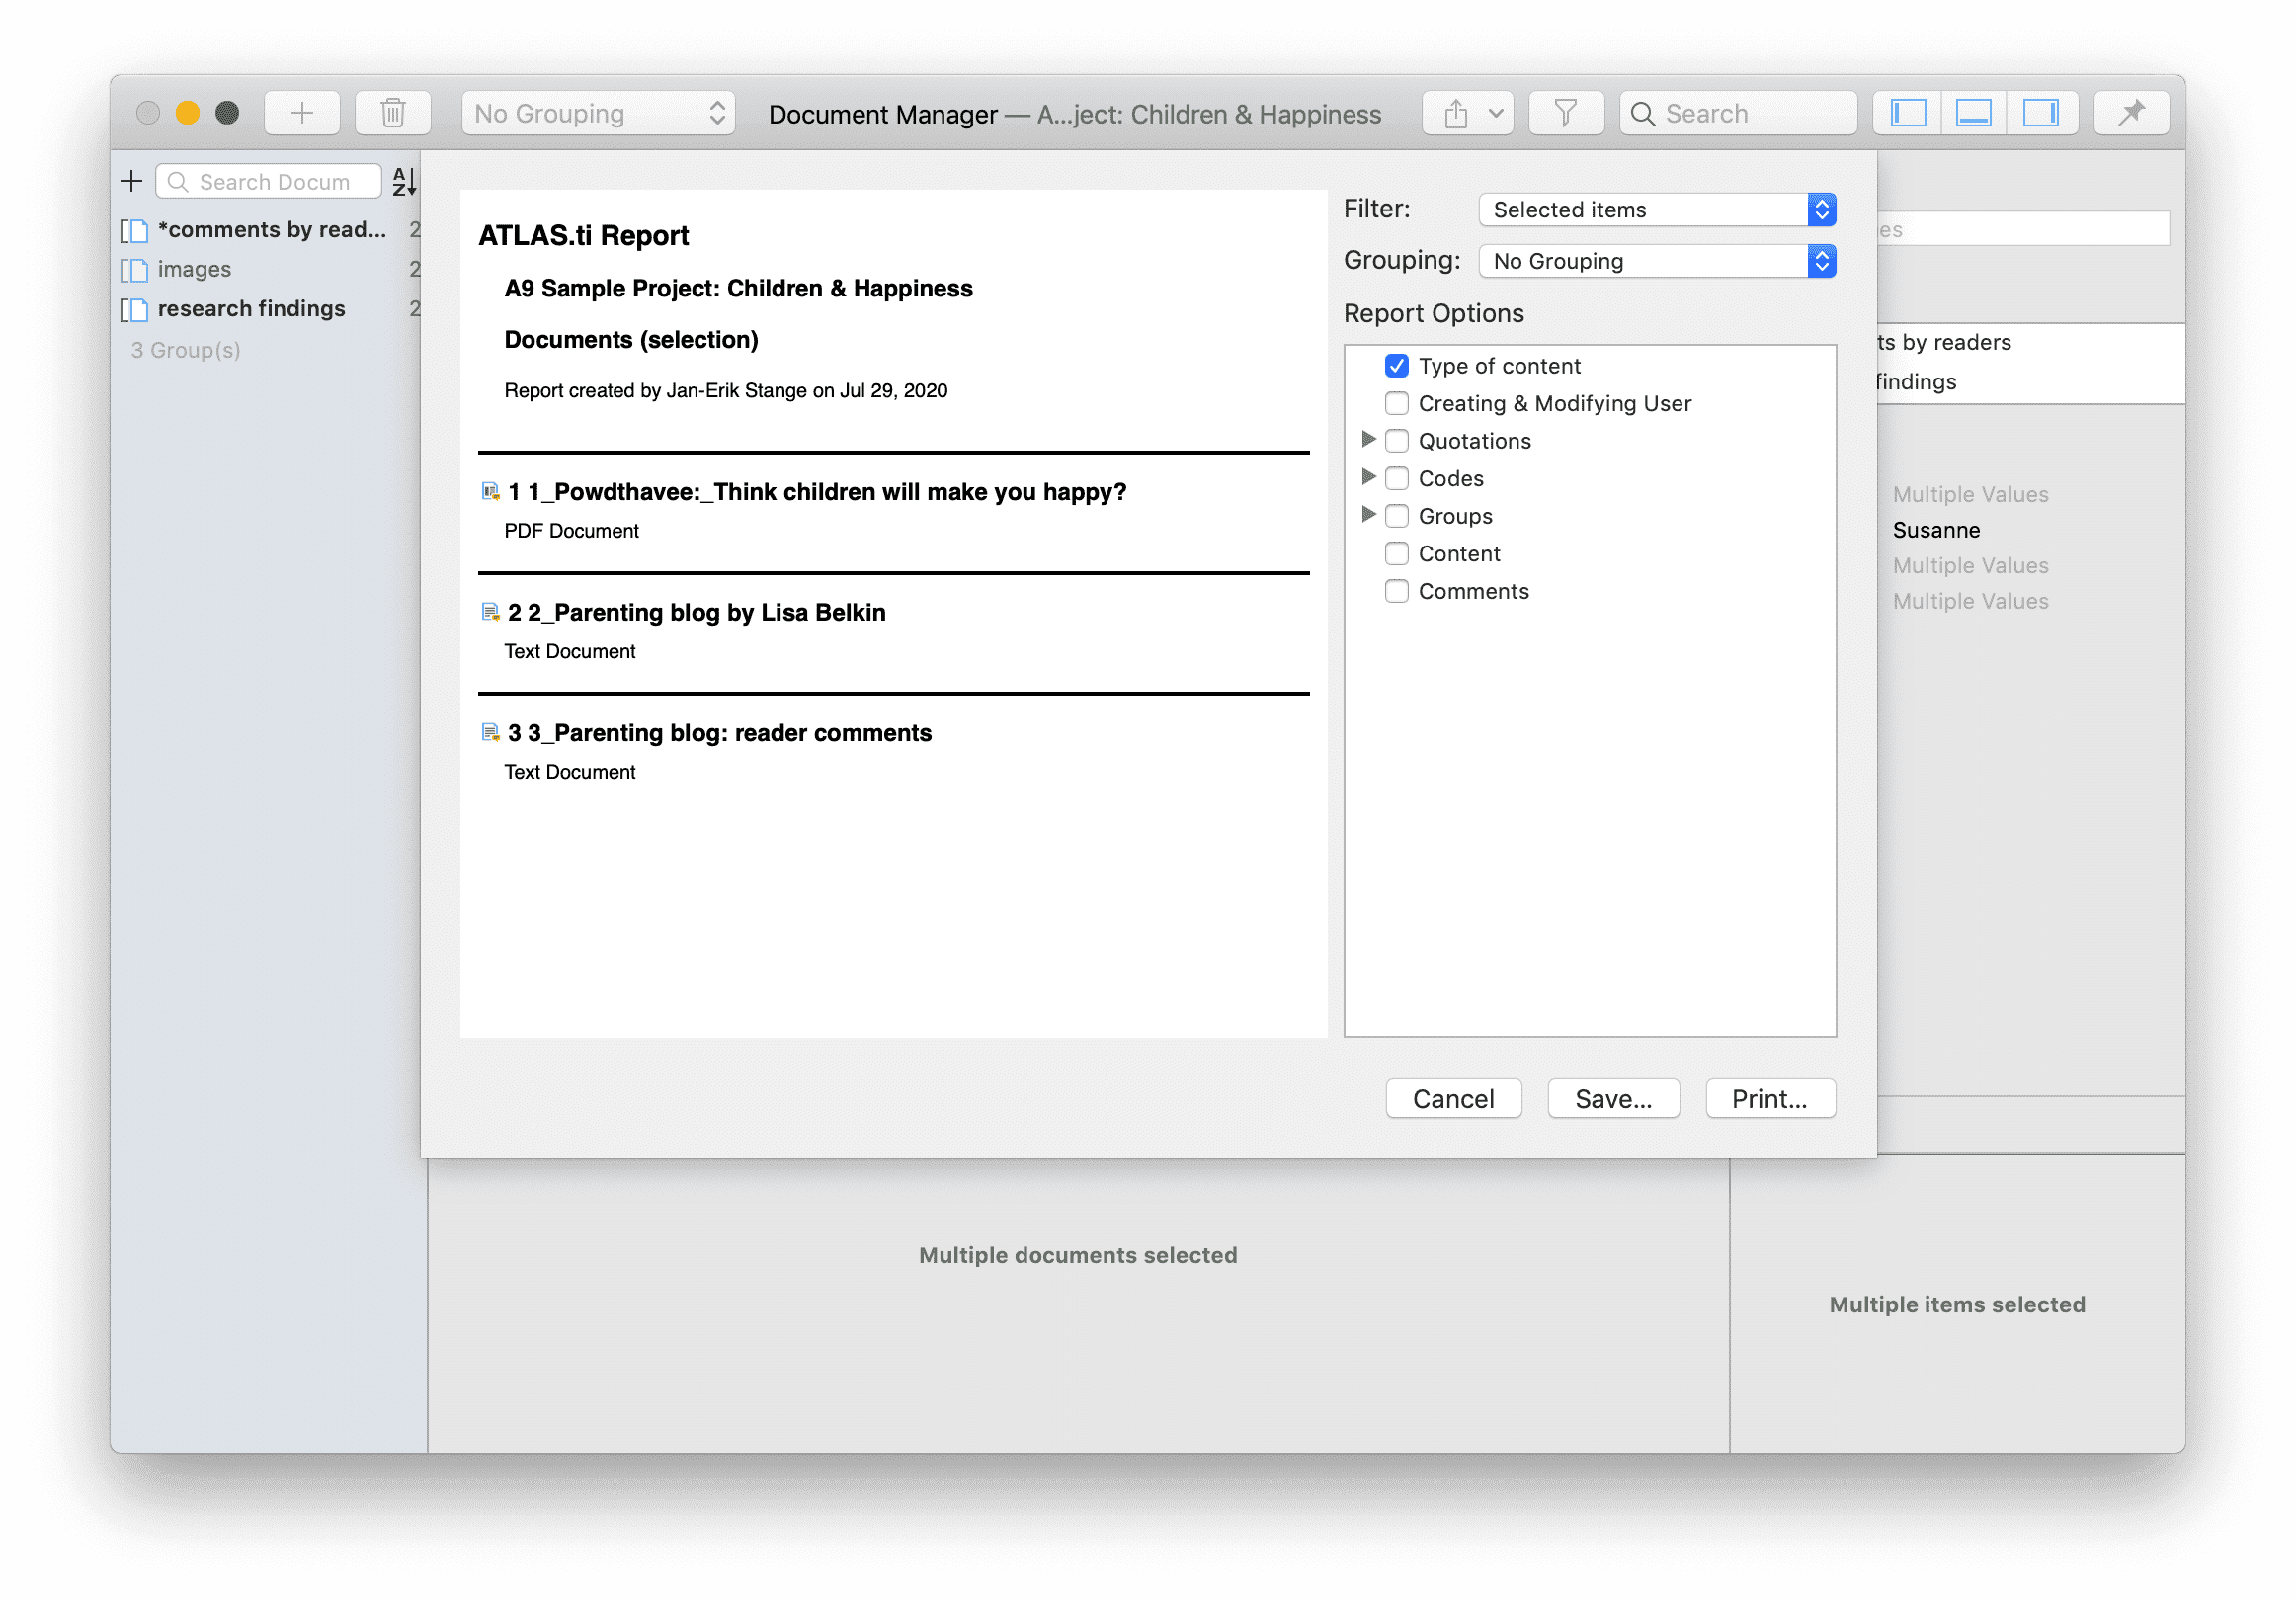
Open a Manager. Click on the drop-down menu of the report button in the toolbar and select Export as Report.
On the left-hand side you see how the report looks like given the current selections. On the right-hand side, you can select further options:
-
Filter: If you selected items before clicking on the report button, you can switch between creating a report for only the selected or all items.
-
Grouping: Depending on the entity type you have different grouping options, e.g. by code, code group or document. Select a grouping option if appropriate.
If you select to group quotations by code, and a quotation is coded by multiple codes groups, the quotations for this code will occur multiple times in the report.
If you select to group by code groups, and a code is a member of multiple code groups, the quotations for this code will occur multiple times in the report.
-
Report options: In this field, you can select which content should be displayed in the report. As soon as you select an option, you see in the preview how it will look like in the report. See below for further detail.
-
Save: This saves the report as Word document. Select a name for the report and a location.
-
Print: You can send the report directly to a printer and print it, or you can save it as PDF file. Other options are:
- Save as PostScript
- Send in Mail
- Send via Messages
- Save to iCloud Drive
- Save to Web Receipts
Appendix
The following information has been compiled for the appendix:
-
Useful Resources: Here you find links to the ATLAS.ti website, the Helpdesk, video tutorials, manuals in PDF format to download, the research blog and publications on the use of ATLAS.ti, including an article by Prof. Krippendorff about the implementation of inter-coder agreement in ATLAS.ti.
System Requirements
The system requirements are:
Hardware: Intel-based PC, 2GHz, Intel Core or compatible CPU, 4GB RAM minimum (8-16GB strongly recommended), 1.5 GB free hard disk. Operating systems: Windows 11 64-bit; Windows 10 64-bit, at least Version 1607, "Anniversary Update." - NOTE: Some special Windows editions, such as Windows 10N and Windows 10 for Virtual Desktops, are NOT supported.
For better natural language processing results, ATLAS.ti can optionally use bigger machine learning models, which require at least 8 GB of RAM.
Useful Resources
The ATLAS.ti Welcome Screen contains links to manuals, sample projects and video tutorials. The News sections informs you about current developments, updates that are released, interesting papers we have come across, use cases, and our newsletter.
The ATLAS.ti Website
The ATLAS.ti website should be a regular place to visit. Here you will find important information such as video tutorials, additional documentation of various software features, workshop announcements, special service providers, and announcements of recent service packs and patches.
Getting Support
From within ATLAS.ti, select Help > Online Resources / Contact Support. Or access the Support Center directly via the above URL.
Video Tutorials
If you like to learn via video tutorials, we offer a range of videos covering technical as well as methodological issues.
Sample Projects
You can download a number of different sample projects from our website. Currently English and Spanish language projects are available. The projects feature different types of data sources:
- text
- image
- video
- geo data
.... and different data types:
- interview transcripts
- reports
- online data
- evaluation data
- survey
- literature review
You can use them for yourself to get to know ATLAS.ti, or you can use them for teaching purposes. If available, also the raw data are provided.
PDF Manuals
ATLAS.ti 22 Full Manual and other documentations.
Research Blog
The ATLAS.ti Research Blog plays a very important role in the development and consolidation of the international community of users. Consultants, academics, and researchers publish short and practical articles highlighting functions and procedures with the software, and recommending strategies to successfully incorporate ATLAS.ti into a qualitative data analysis process. We invite you to submit short articles explaining interesting ways of making the best use of ATLAS.ti, as well as describing how you are using it in your own research. To do so, please contact us.
Inter-coder Agreement in ATLAS.ti by Prof. Krippendorff
We have been closely working with Prof. Krippendorff on the implementation to make the original Krippendorff alpha coefficient useful for qualitative data analysis. This for instance required an extension and modification of the underlying mathematical calculation to account for multi-valued coding.. You can download an article written by Prof. Krippendorff about the implementation of the alpha family of coefficients in ATLAS.ti.
Publications
-
Friese, Susanne (2022). Role and Impact of CAQDAS Software for Designs in Qualitative Research. In Uwe Flick (ed). The SAGE Handbook of Qualitative Research Design. Chapter 19. London: Sage.
-
Friese, Susanne (2021).Grounded Theory Analysis and CAQDAS: A happy pairing or remodeling GT to QDA? In: Antony Bryant and Kathy Charmaz (eds.). The SAGE Handbook of Current Developments in Grounded Theory, 282-313. London: Sage.
-
Friese, Susanne (2019). Qualitative Data Analysis with ATLAS.ti. London: Sage. 3. edition.
-
Friese, Susanne (2019). Grounded Theory Analysis and CAQDAS: A happy pairing or remodelling GT to QDA? In: Antony Bryant and Kathy Charmaz (Eds.). The SAGE Handbook of Current Developments in Grounded Theory, 282-313. London: Sage.
-
Friese, Susanne (2018). Computergestütztes Kodieren am Beispiel narrativer Interviews. In: Pentzold, Christian; Bischof, Andreas & Heise, Nele (Hrsg.) Praxis Grounded Theory. Theoriegenerierendes empirisches Forschen in medienbezogenen Lebenswelten. Ein Lehr- und Arbeitsbuch, S. 277-309. Wiesbaden: Springer VS.
-
Friese, Susanne, Soratto, Jacks and Denise Pires (2018). Carrying out a computer-aided thematic content analysis with ATLAS.ti. MMG Working Paper 18-0.
-
Friese, Susanne (2016). Grounded Theory computergestützt und umgesetzt mit ATLAS.ti. In Claudia Equit & Christoph Hohage (Hrsg.), Handbuch Grounded Theory – Von der Methodologie zur Forschungspraxis (S.483-507). Weinheim: Beltz Juventa.
-
Friese, Susanne (2016). Qualitative data analysis software: The state of the art. Special Issue: Qualitative Research in the Digital Humanities, Bosch, Reinoud (Ed.), KWALON, 61, 21(1), 34-45.
-
Friese, Susanne (2016). CAQDAS and Grounded Theory Analysis. Working Papers WP 16-07
-
McKether, Will L. and Friese, Susanne (2016). Qualitative Social Network Analysis with ATLAS.ti: Increasing power in a blackcommunity.
-
Friese, Susanne & Ringmayr, Thomas, Hrsg (2016). ATLAS.ti User Conference proceedings: Qualitative Data Analysis and Beyond. Universitätsverlag TU Berlin. https://depositonce.tu-berlin.de/bitstream/11303/5404/3/ATLASti_proceedings_2015.pdf
-
Paulus, Trena M. and Lester, Jessica. N. (2021). Doing Qualitative Research in a Digital World. Thousand Oaks, CA: Sage.
-
Paulus, Trena M., Lester, Jessica. N. and Dempster, Paul (2013).Digital Tools for Qualitative Research. Thousand Oaks, CA: Sage.
-
Silver, Christina and Lewins, Ann (2014). Using Software in Qualitative Research. London: Sage.
-
Konopásek, Z. (2008). Making Thinking Visible with Atlas.ti: Computer Assisted Qualitative Analysis as Textual Practices. Forum Qualitative Sozialforschung / Forum: Qualitative Social Research, 9(2).
-
Woolf,Nicholas H. and Silver, Christina (2018). Qualitative Analysis Using ATLAS.ti: The Five Level QDA Method. New York: Routledge.
Get In Touch
Social Media
You can access all social media channels from within ATLAS.ti by selecting Help > Social Media.
Stay updated with the latest news on product updates, special offers, new training materials, or interesting articles and links we find. We are also happy to hear from users via these channels. Stop by and let us know about your projects and experience with ATLAS.ti!
Stop by and let us know about your projects and experience with ATLAS.ti!
The ATLAS.ti YouTube channel offers a variety of video materials:
- Overview of the software functionality
- Recorded webinars
- Video tutorials that help you to learn the software.
Videos are available in English and Spanish.