
The Code Co-Occurrence Table
Video Tutorial: Code Co-occurrence Tools and Analysis
The Co-occurrence Table shows the frequencies of co-occurrence in form of a matrix similar to a correlation matrix that you may know from statistical software.
To open the tool, select Analysis > Code Co-occurrence Table.
Next you need to select the codes that you want to relate to each other:
Select codes from the first list for the table columns, and codes from the second list for the table rows. To select an item, you need to click the check-box in front of it. It is also possible to select multiple items via the standard selection techniques using the cmd or shift-key. After highlighting multiple items, push the space bar to activate the check boxes of all selected items.
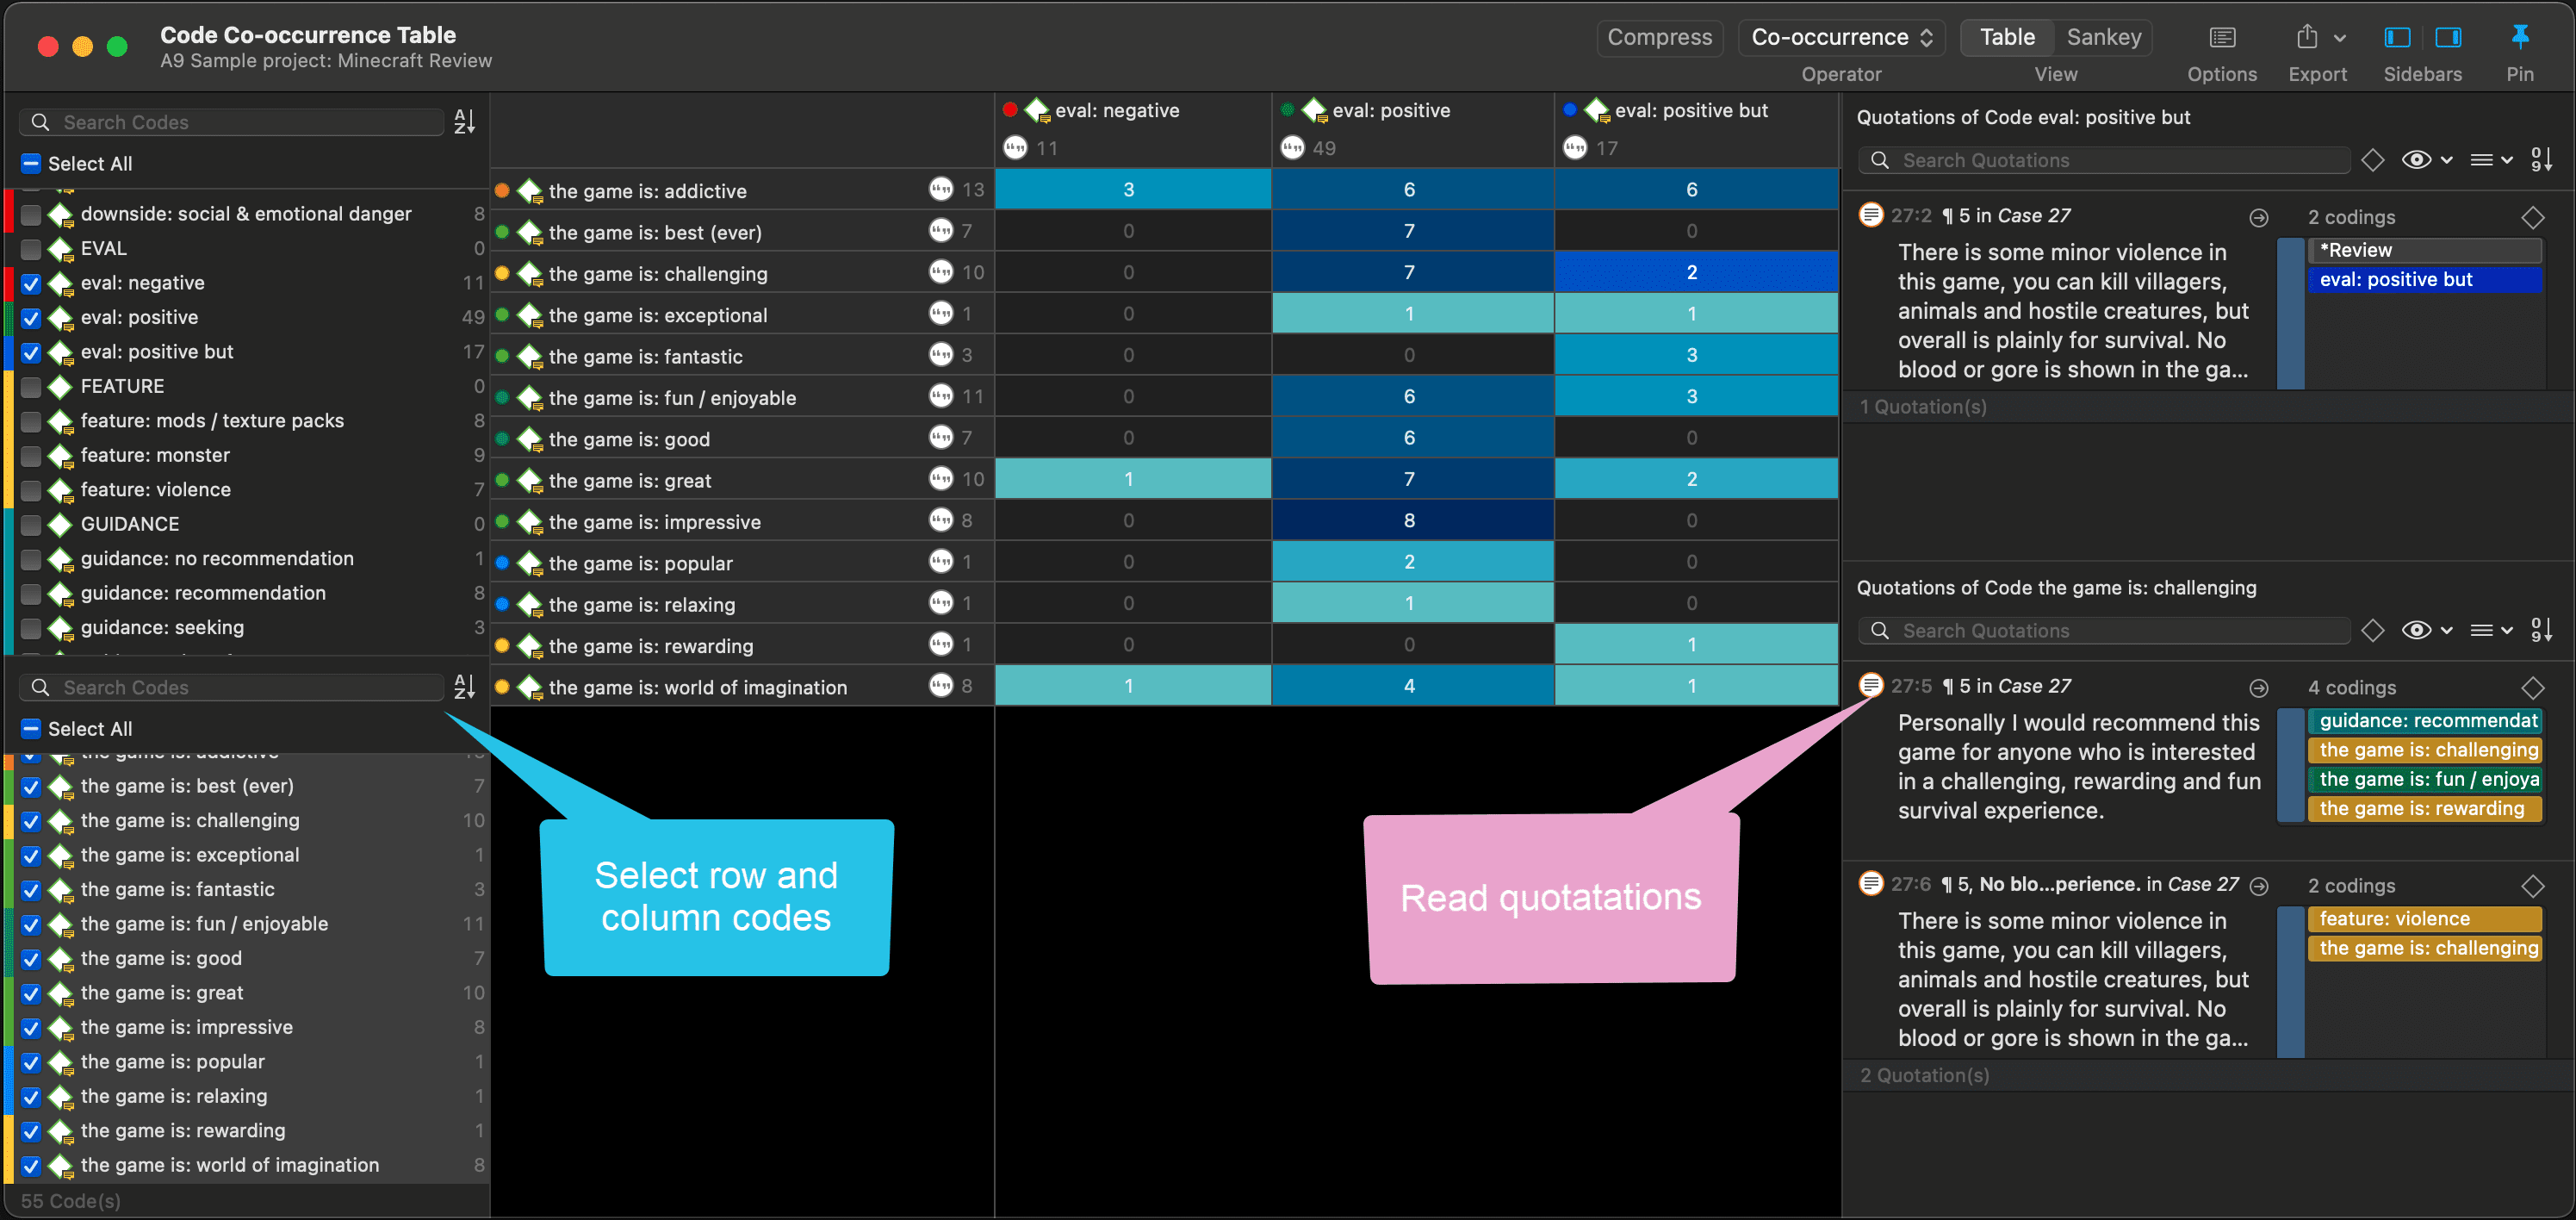
Code Co-occurrence Table in dark mode
How to read the table
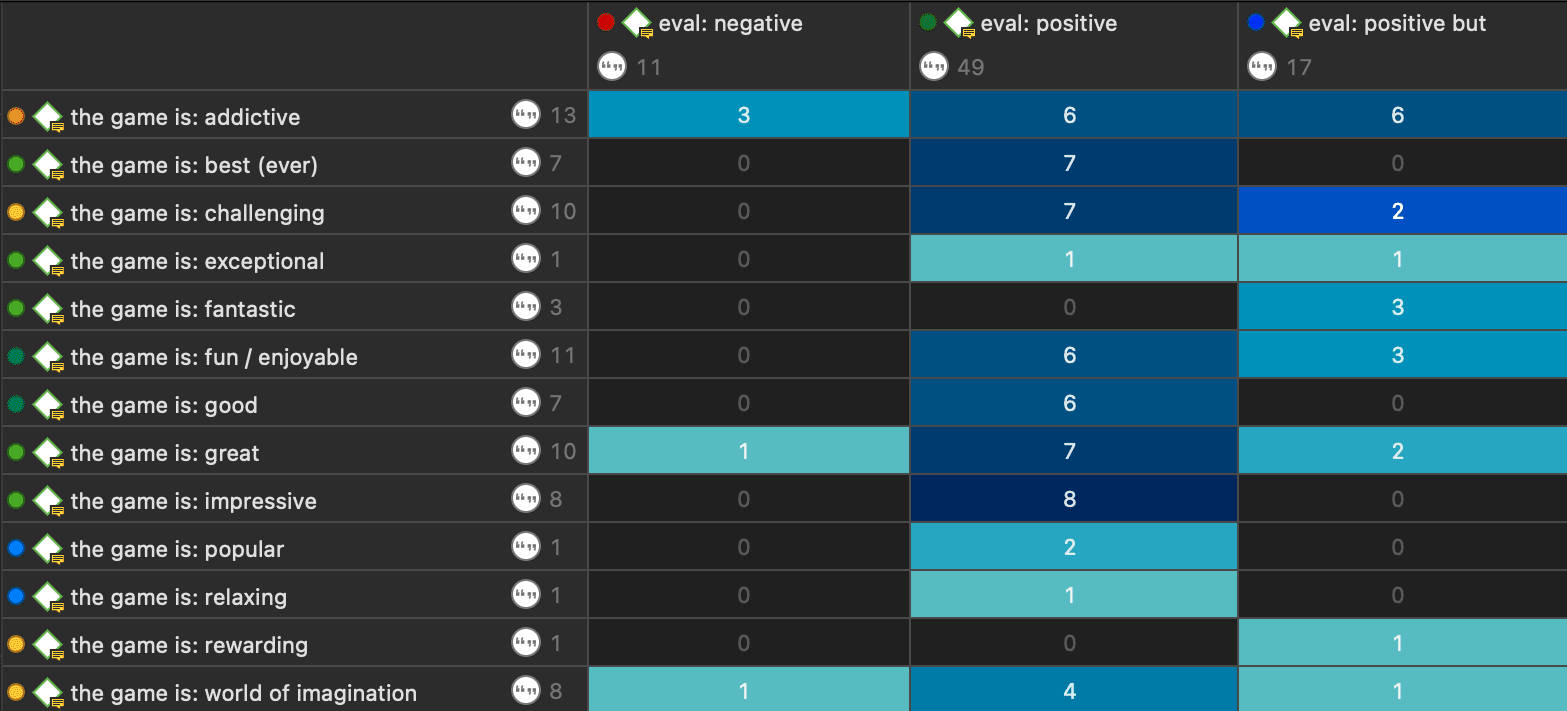
First column / first row: The number below and behind each code shows how often the code is applied in the entire project. This helps you to better evaluate the number of co-occurrences in the table cells.
The number in the cell indicates the number of hits, how often the two code co-occur. This means that the number of co-occurring „events" and not the number of quotations are counted. If a single quotation is coded by two codes or if two overlapping quotations are coded by two codes, this counts in both cases as a single co-occurrence.
Retrieving the qualitative data: If you click on a cell, the quotations of the corresponding row and column codes are displayed next to the table in the Quotation Reader.
The quotation reader always displays two lists of quotations: the quotations of the column code, and the quotations of the row code.
Code Co-Occurrence Table Toolbar

Compress: This is a quick way to remove all rows or columns that only show empty cells. This is the same as manually deactivating codes that yield no results. Thus, you cannot decompress a table!
Operator: You can switch between the Co-occur and the AND operator. If the table cells should only show a result if the quotations overlap 100%, thus the two codes code exactly the same data segment, then you can select AND :
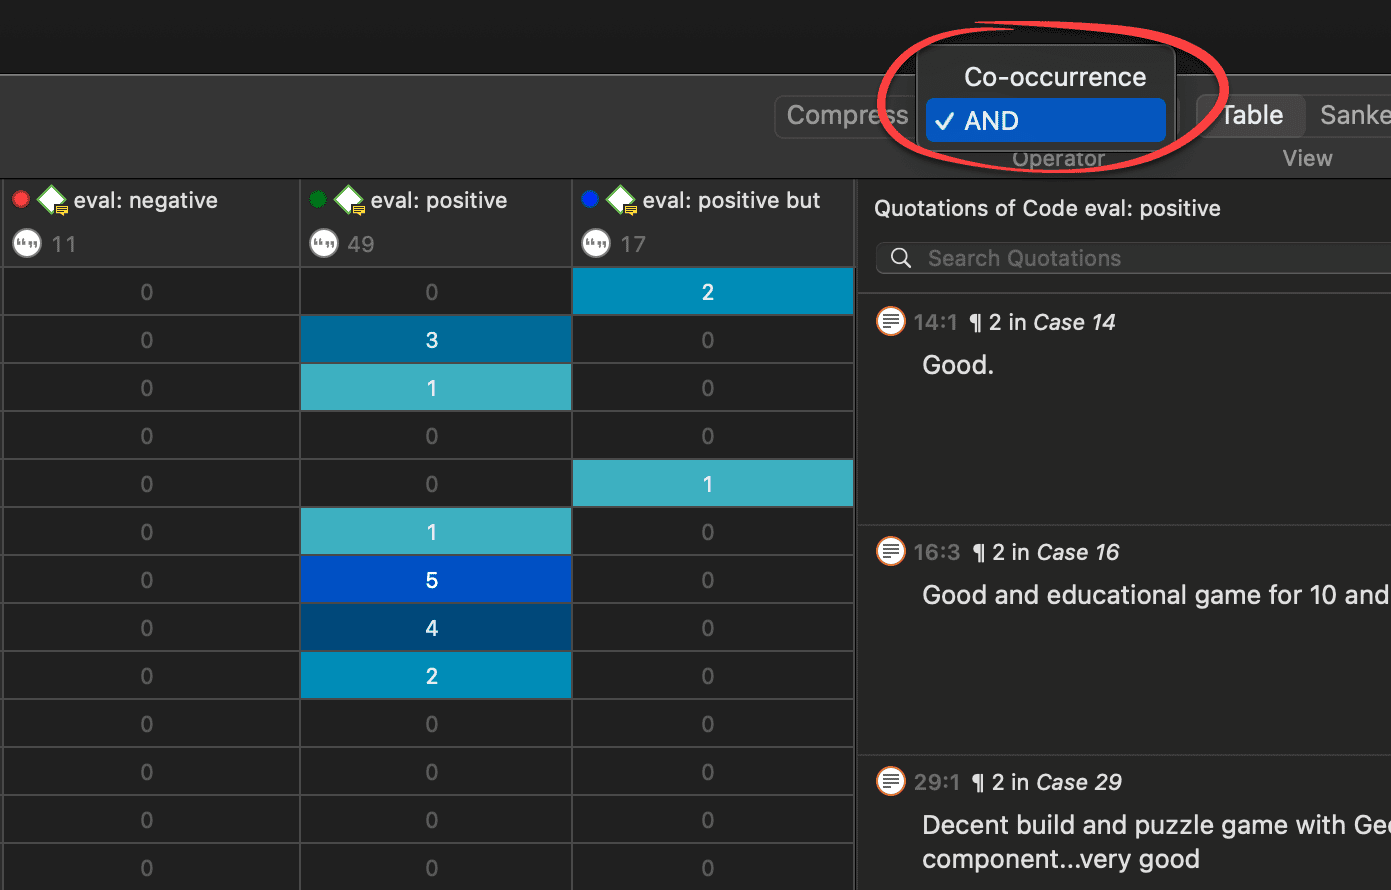
The table now only displays quotations that are coded by both the row and column codes
Table / Sankey: You can switch between table view, and a visualization of the selected data in form of a Sankey diagram. For further information, see below and the full manual.
Options: For further information, see the main manual.
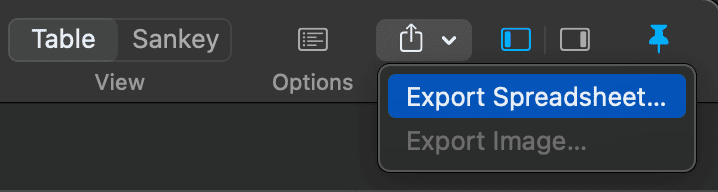
Export: You can export the table as Excel spreadsheet, and the Sankey diagram as image.
Sankey Diagram
As soon as you create a table, a Sankey diagram will be shown in the area below the table. The Sankey diagram ist an alternative view complementing the original table view.
The basic table data model of rows and column entities is represented in the Sankey model as nodes and edges, the strength of co-occurrence between pairs of nodes. For each table cell containing a value, an edge is displayed between the diagram nodes. The thickness of the edges resemble the cell values of the table. Cells with value 0 are not displayed in a Sankey view.
If you select an edge, the corresponding quotations are displayed on the right-hand side in a Quotation Reader.
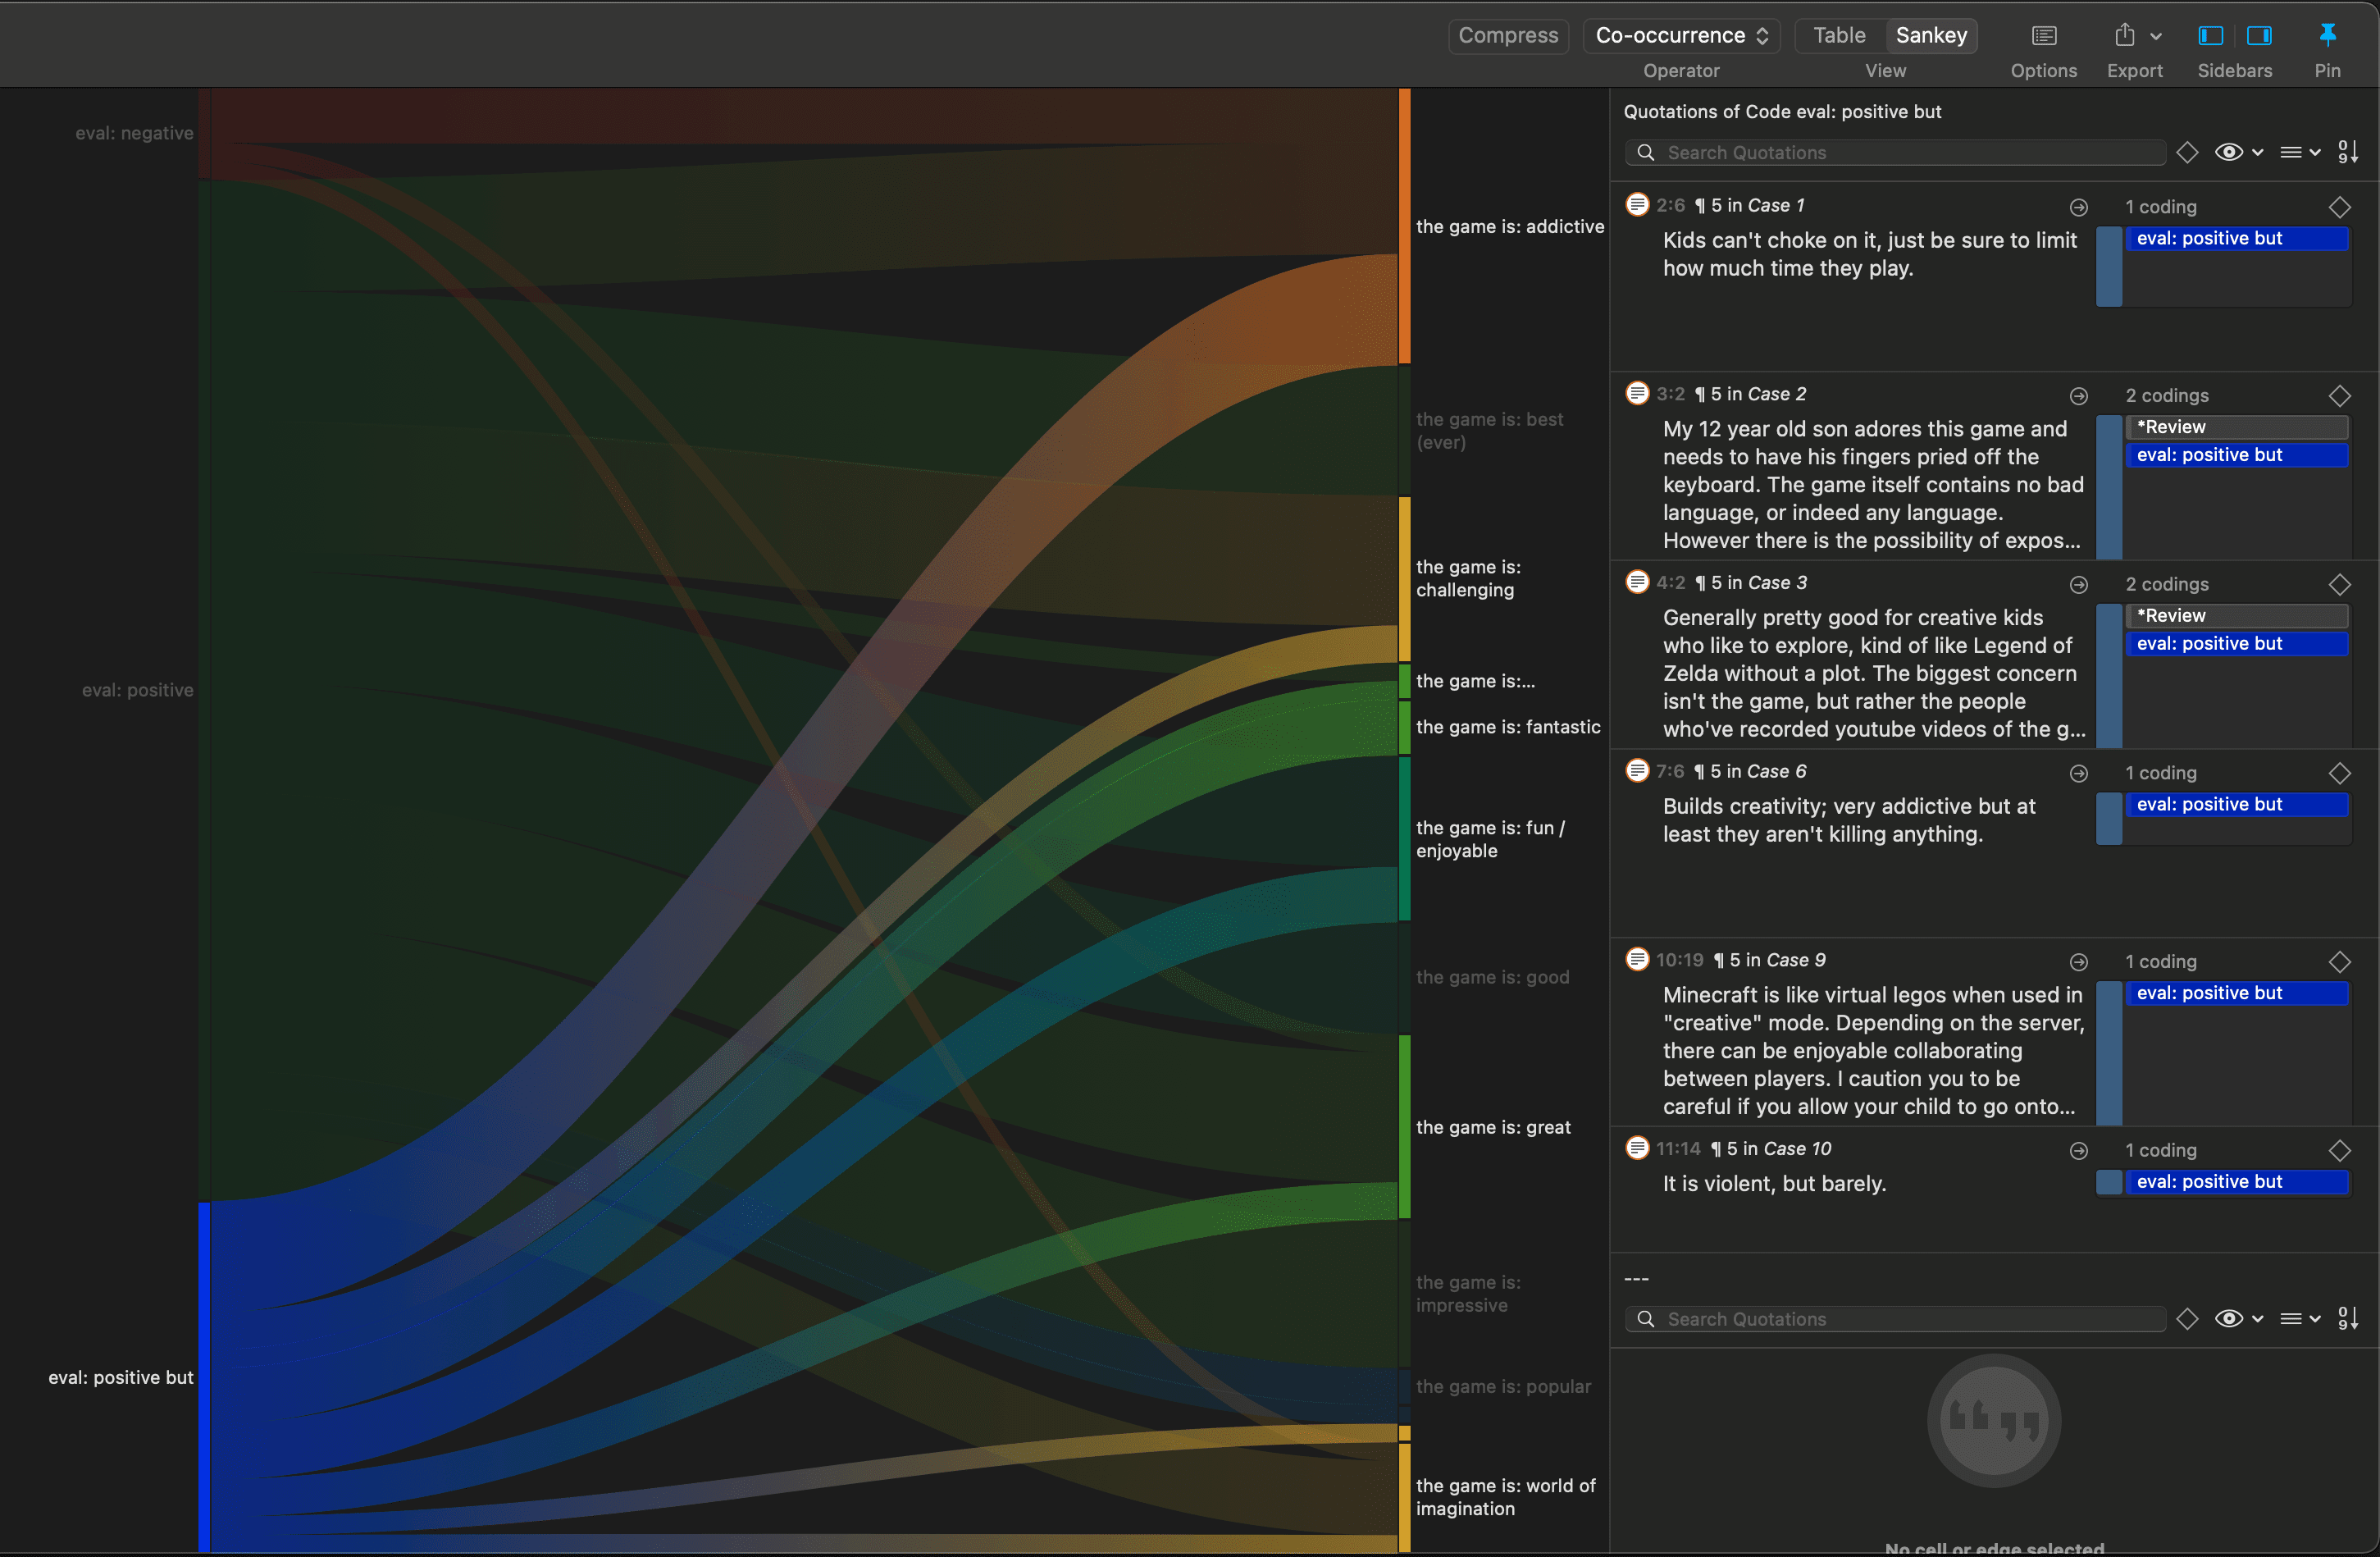
Sankey diagram with one edge highlighted