
The Code Co-Occurrence Table
Video Tutorial: [Code Co-occurrence Tools and Analysis]
The co-occurrence tools search for codes that have been applied either to the same quotation or to overlapping quotations. Using these tools you can find out which topics are mentioned together or are in proximity to each other.
The results depend on how you have coded the data. If you want to examine the proximity of certain issues, then you have to code overlapping segments, or create one quotation and apply multiple codes.
The Co-occurrence Table shows the frequencies of co-occurrence in form of a matrix similar to a correlation matrix that you may know from statistical software.
To open the tool, select the Analyze tab and from there the Co-Oc Table.
Next you need to select the codes that you want to relate to each other:
Select one or multiple codes from the first list for table columns, and from the second list for the table rows. You can switch around the rows and codes after the table has been created.
To select an item, you need to click the check-box in front of it. It is also possible to select multiple items via the standard selection techniques using the Ctrl or Shift-key. After highlighting multiple items, push the space bar to activate the checkboxes of all selected items, or right click and chose Check Selected from the context menu.
The context menu in each of the selection list also allows you to uncheck all selected codes, to select all codes, to unselect all codes, to invert the selection, or to invert the checked codes.
Below each table, you can select to see a Sankey Diagram or a Bar Chart that visualize the data in the table. See below for further information.
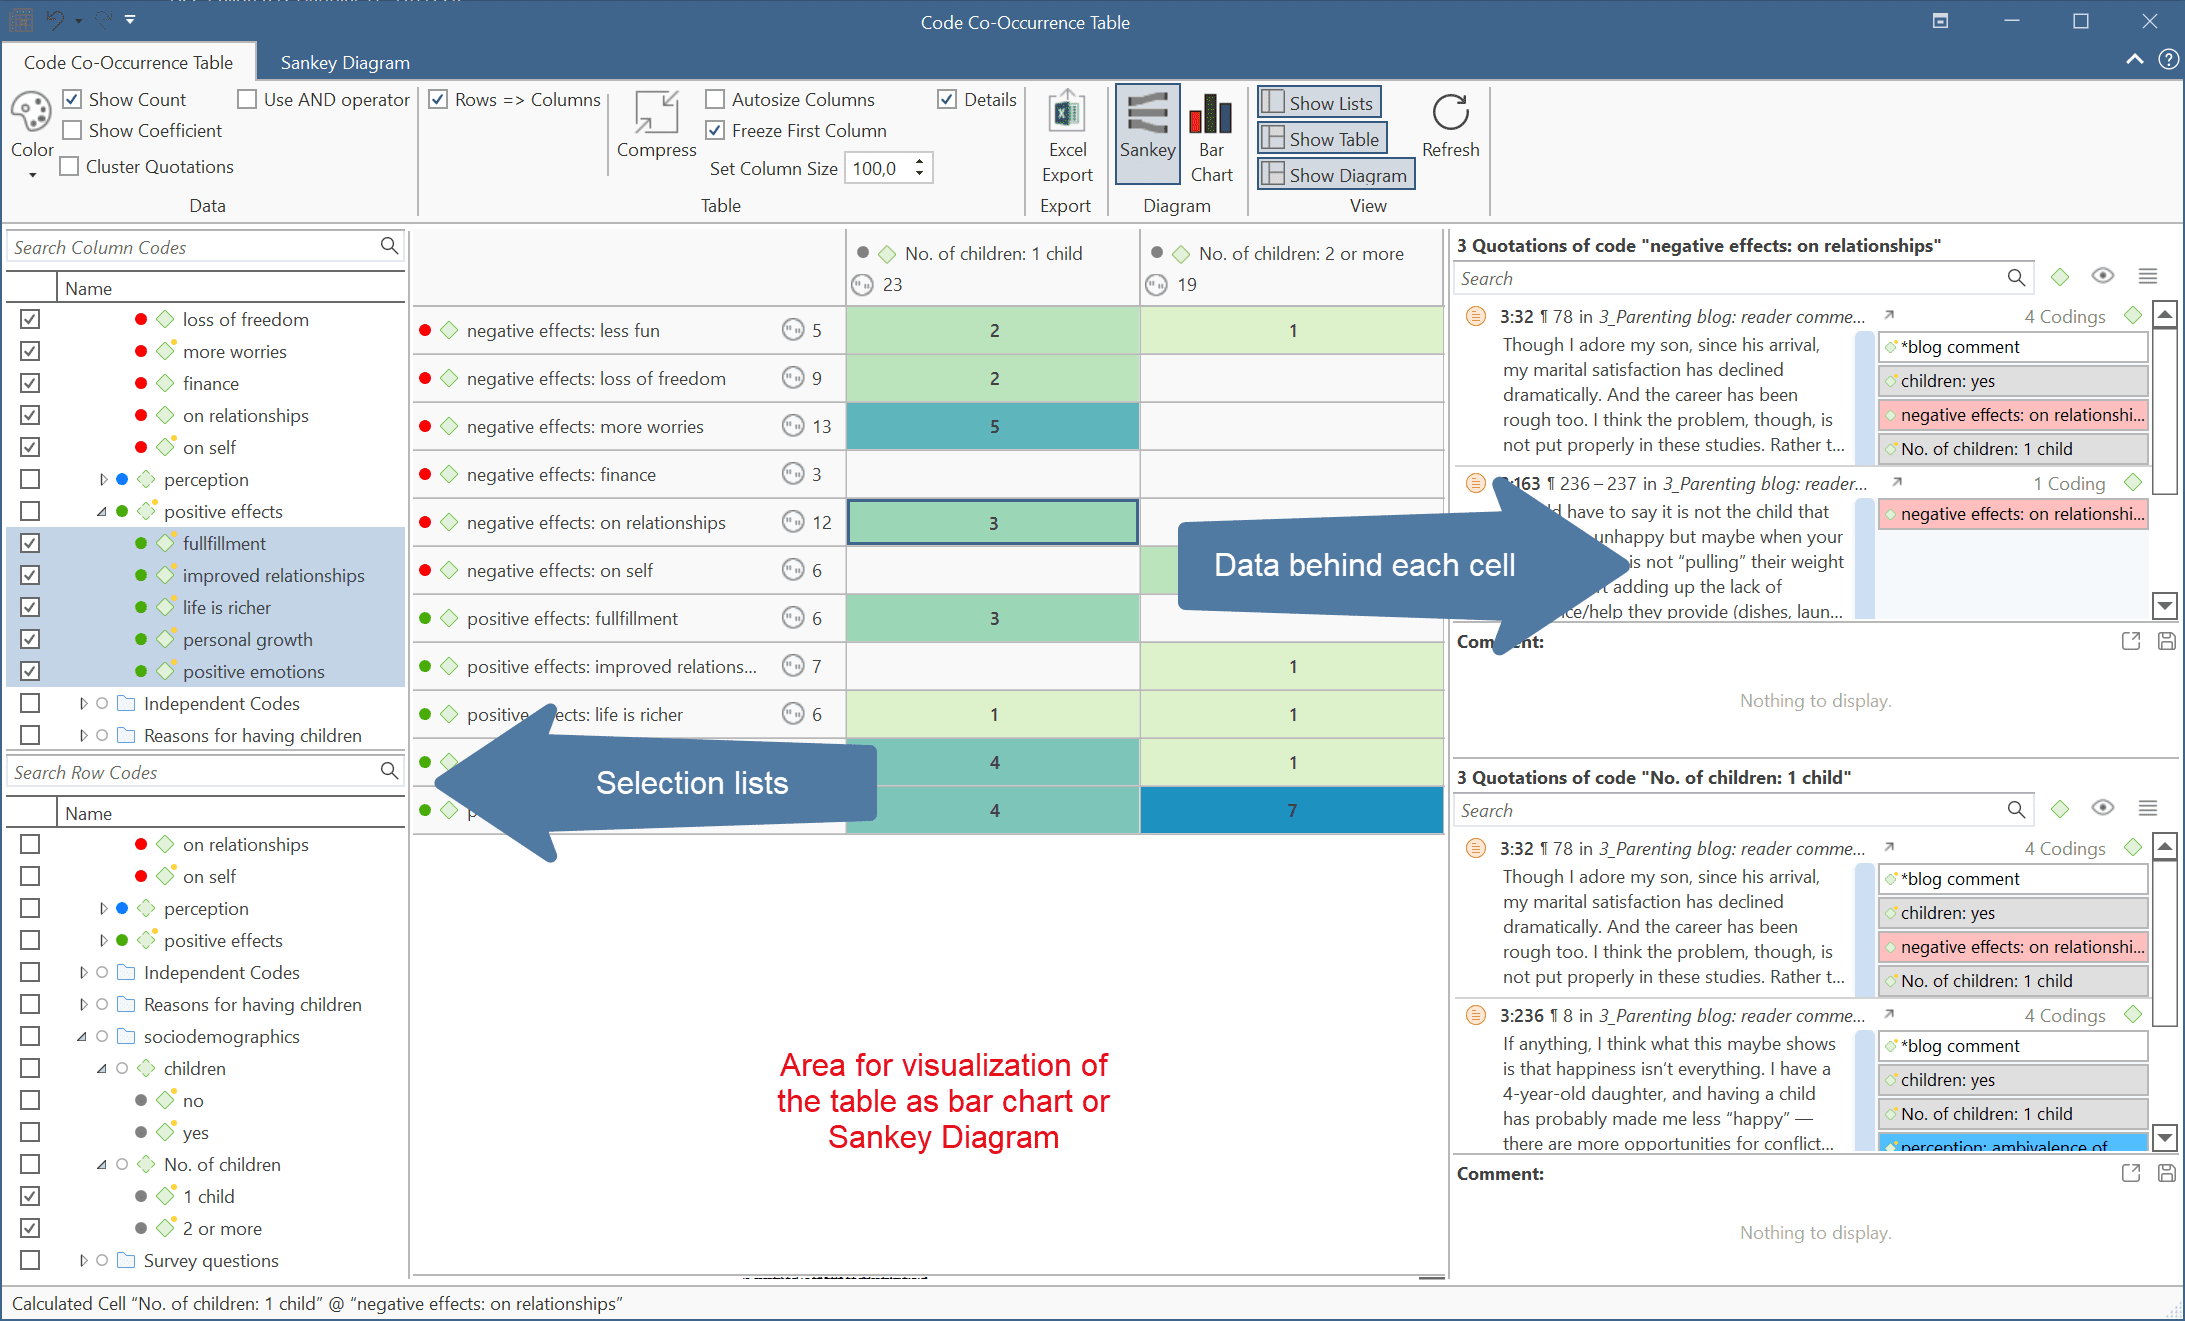
How to Read the Table
-
First column / first row: The number below and behind each code shows how often the code is applied the entire project. This helps you to better evaluate the number of co-occurrences in the table cells.
-
The number in the cell indicates the number of hits, how often the two code co-occur. This means that the number of co-occurring „events" and not the number of quotations are counted. If a single quotation is coded by two codes or if two overlapping quotations are coded by two codes, this counts in both cases as a single co-occurrence.
-
If you click on a cell, the quotations of the corresponding row and column codes are displayed next to the table in the Quotation Reader.
The quotation reader always displays two lists of quotations: the quotations of the column code, and the quotations of the row code.
Table Visualizations
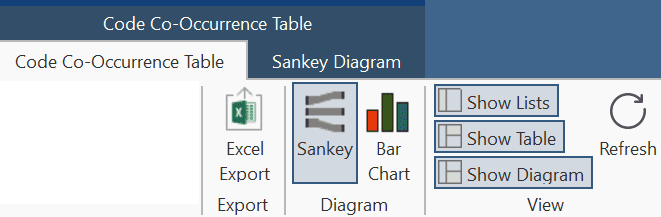
As soon as you create a table, a bar chart or Sankey diagram will be shown in the area below the table. You can select to either see the Sankey Diagram or the Bar Chart. It is also possible to only show the table or the selected diagram:
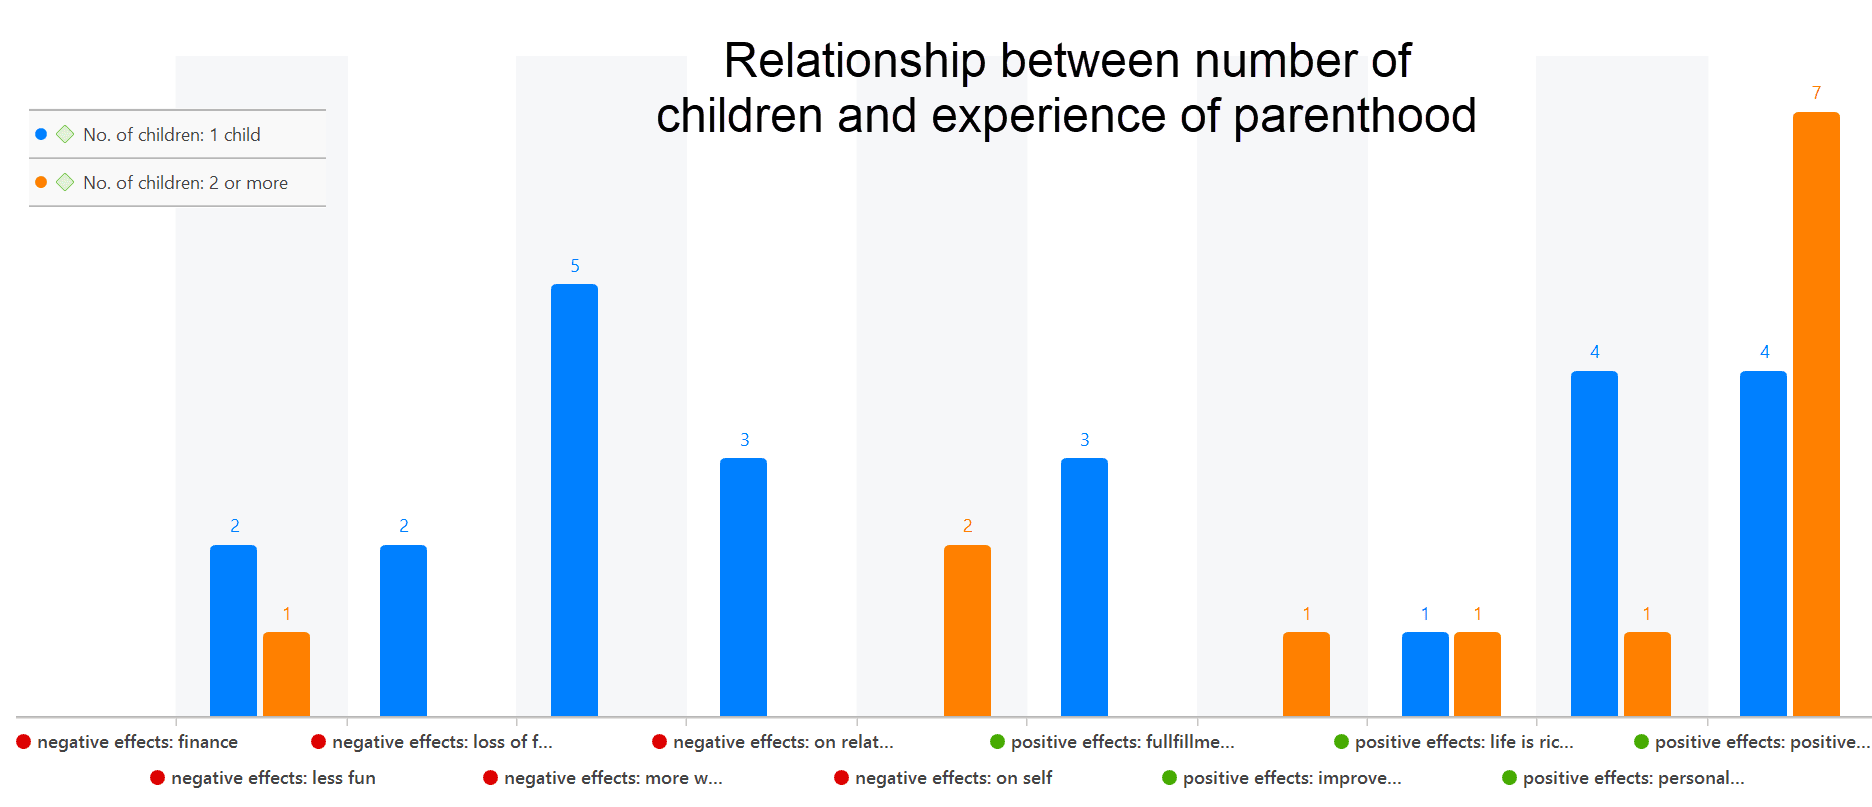
Bar Chart
For the visualization as bar chart, it is often preferable to change the code colors. You may also want to switch around the rows and the columms. You find this option in the ribbon of the Code Co-occurrence Table.
To create the table below, the color of the two subcodes '1 child' and '2 or more' were changed to blue and orange. We see more orange bars (people with two or more children) on the right-hand side of the graph where the code for positive experiences are located.
If we change the rows and the columns, so that the number of children is on the x-axis, we get a more meaningful graph if we change the code colors for the subcodes of positive and negative effects. The negative effects have colors ranging from yellow to pink, the colors for positive effect range from green to blue.
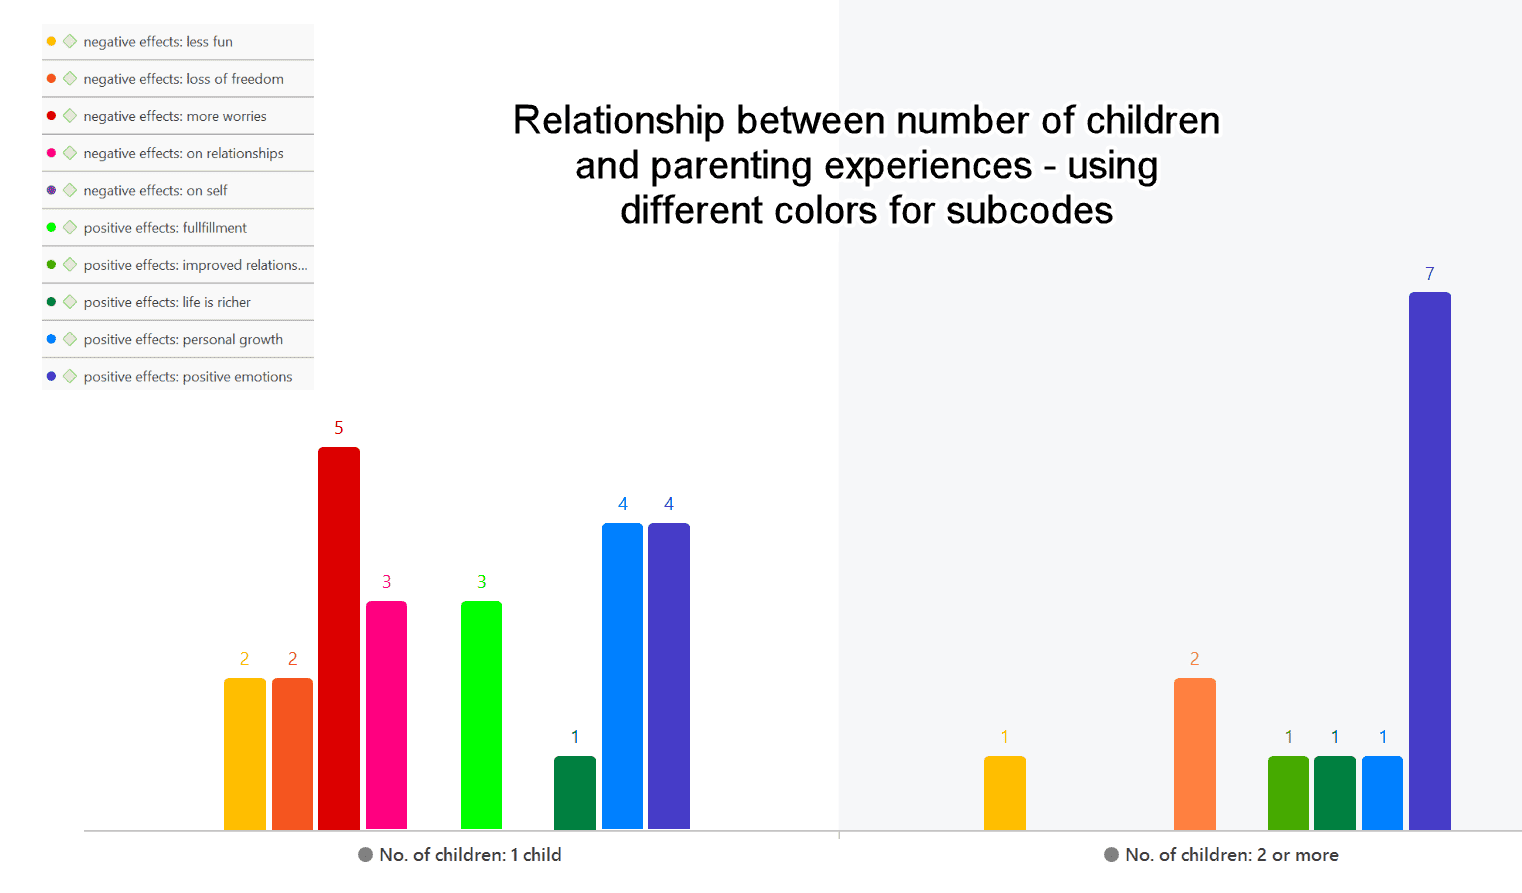
There is currently no legend. The one you see in the images are copy & pasted screenshots. Also, the code colours have to be changed manually. For a more convenient work with the graphics there will be further options in future updates.
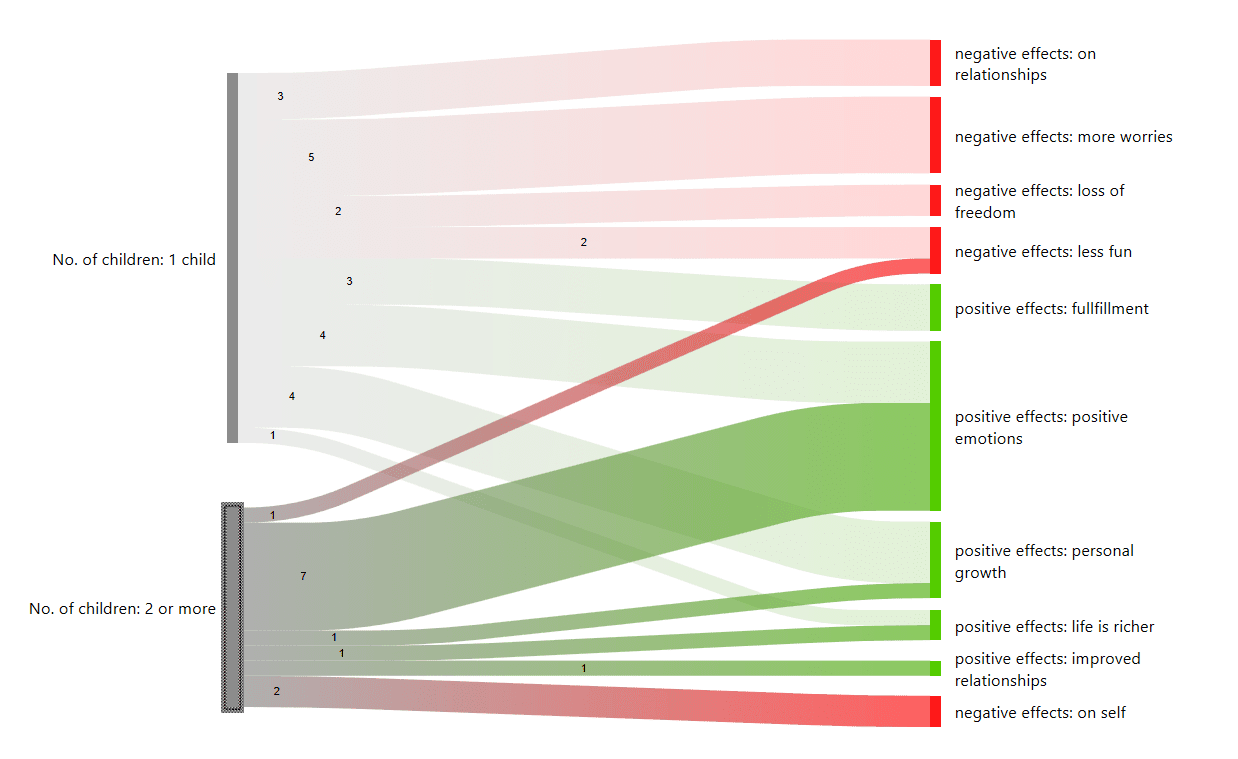
Sankey Diagram
The basic table data model of rows and column entities is represented in the Sankey model as nodes and edges, the strength of co-occurrence between pairs of nodes.
For each table cell containing a value, an edge is displayed between the diagram nodes. The thickness of the edges resemble the cell values of the table. Cells with value 0 are not displayed in a Sankey view.
What can be seen from the Sankey Diagram below is that those respondents with 2 or more children report fewer negative experiences of parenthood. All subcodes for negative experiences are red, all subcodes for positive experience are green.
You find further information on how to work with Sankey diagrams here: Visualization of the Code Co-occurrence Tabel.