
The Code Co-Occurrence Table
The co-occurrence tools search for codes that have been applied either to the same quotation or to overlapping quotations. Using these tools you can find out which topics are mentioned together or are in proximity to each other.
The results depend on how you have coded the data. If you want to examine the proximity of certain issues, then you have to code overlapping segments, or create one quotation and apply multiple codes.
To open the tool, select the Analyze tab and click Co-Oc Table.
Next you need to select the codes that you want to relate to each other:
Select one or multiple codes from the first list for table columns , and from the second list for the table rows.
To select an item, you need to click the check-box in front of it. It is also possible to select multiple items via the standard selection techniques using the Ctrl or Shift-key. After highlighting multiple items, push the space bar to activate the check boxes of all selected items, or right click and chose Check Selected from the context menu.
The context menu in each of the selection list also allows you to uncheck all selected code, to select all codes, to unselect all codes, to invert the selection, or to invert the checked codes.
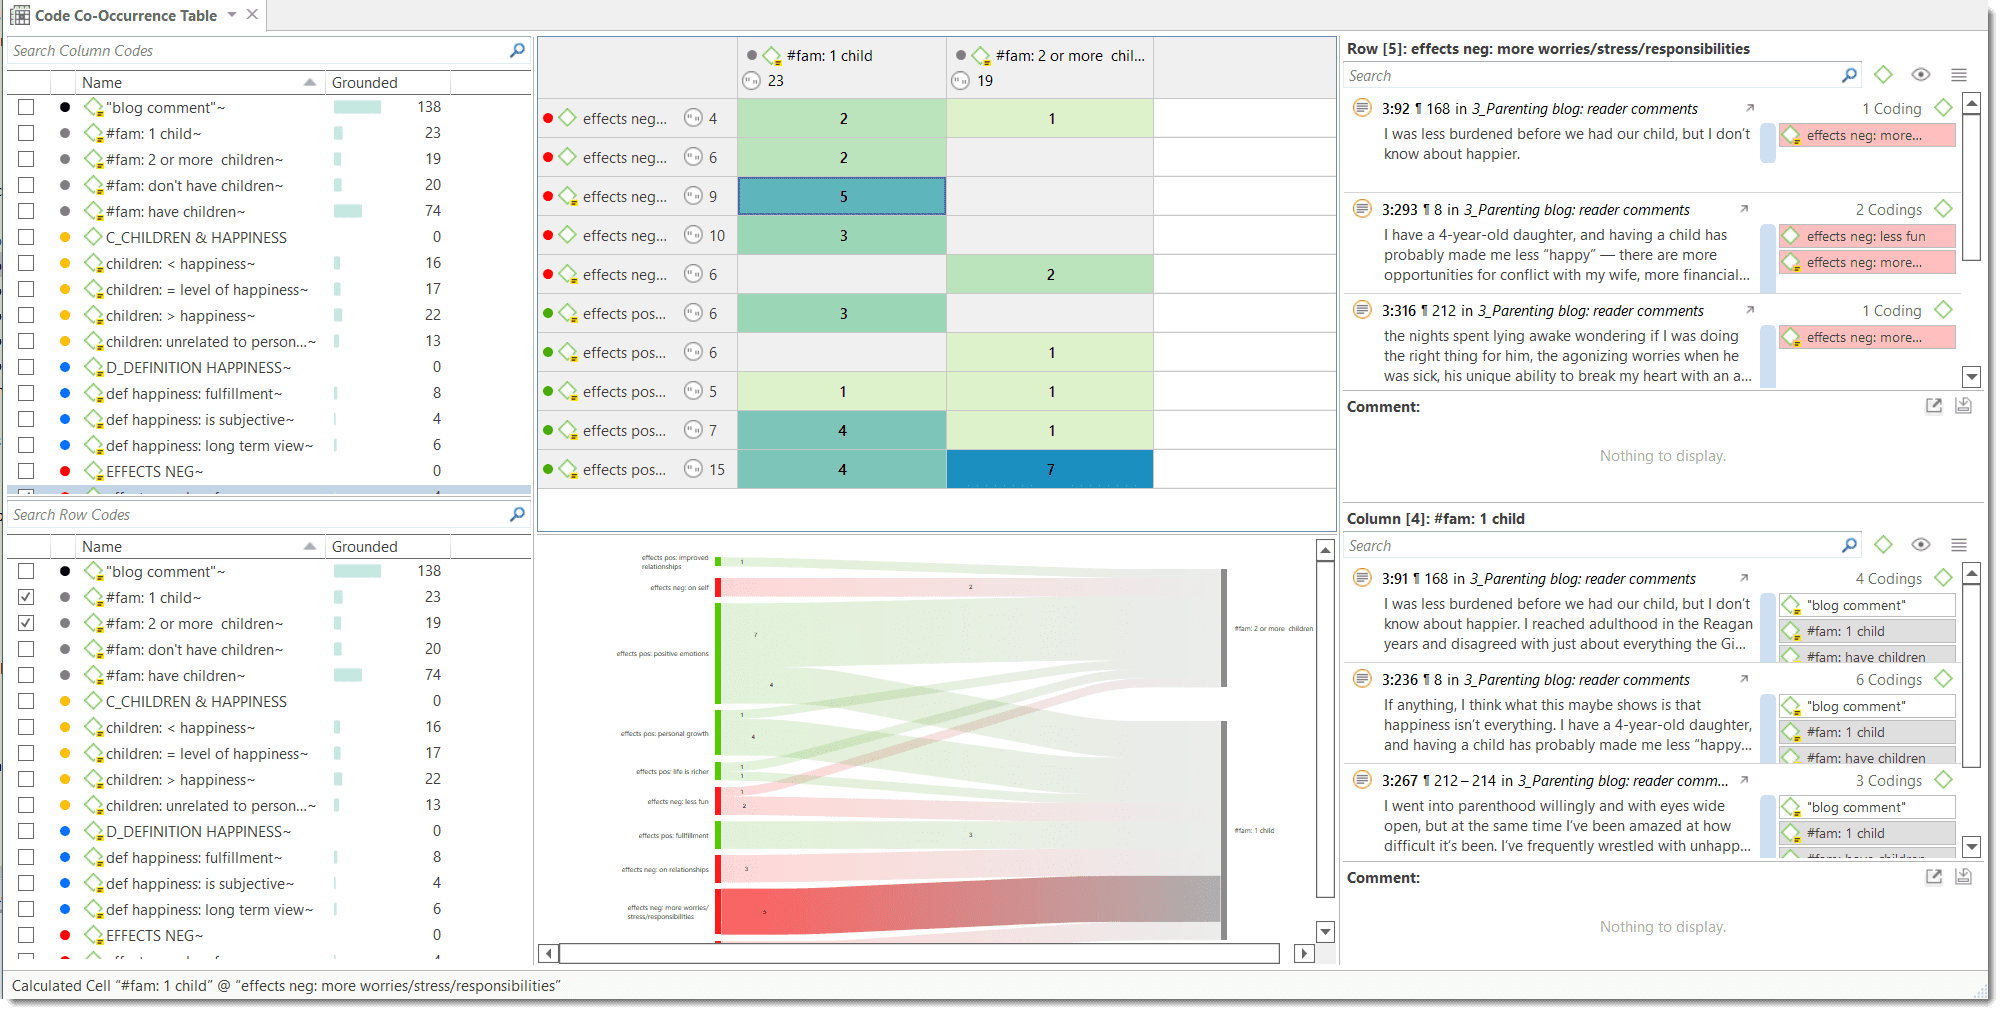
The Co-occurrence Table shows the frequencies of co-occurrence in form of a matrix similar to a correlation matrix that you may know from statistical software.
How to Read the Table
-
First column / first row: The number below and behind each code shows how often the code is applied the entire project. This helps you to better evaluate the number of co-occurrences in the table cells.
-
The number in the cell indicates the number of hits, how often the two code co-occur. This means that the number of co-occurring „events" and not the number of quotations are counted. If a single quotation is coded by two codes or if two overlapping quotations are coded by two codes, this counts in both cases as a single co-occurrence.
-
If you click on a cell, the quotations of the corresponding row and column codes are displayed next to the table in the Quotation Reader.
-
Below the table, the Sankey Diagram is shown. You can view both at the same time or deselect either the table or the Sankey Diagram in the ribbon.
The quotation reader always displays two lists of quotations: the quotations of the column code, and the quotations of the row code.
Sankey Diagram
As soon as you create a table, a Sankey diagram will be shown in the area below the table. The Sankey diagram ist an alternative view complementing the original table view.
The basic table data model of rows and column entities is represented in the Sankey model as nodes and edges, the strength of co-occurrence between pairs of nodes. For each table cell containing a value, an edge is displayed between the diagram nodes. The thickness of the edges resemble the cell values of the table. Cells with value 0 are not displayed in a Sankey view.
You find further information on how to work with Sankey diagrams here: Visualization of the Code Co-occurrence Tabel.