
Code-Document Table
You can use the Code Document Table for within and across documents or group comparisons by relating codes or code groups and documents or document groups to each other.
Running an Analysis in the Code Document Table
In the Home ribbon, select the Analyze tab and from there the Code Document Table.
inst
Select codes or code groups for the table rows. The selected codes / code groups are added to the table.
inst
Select documents or document groups for the table columns. The selected documents / document groups are added to the table.
tip
How to make selections: To select an item, you need to click the check-box in front of it. It is also possible to select multiple items via the standard selection techniques using the Ctrl or Shift-key. After highlighting multiple items, push the space bar to activate the check boxes of all selected items, or right click and chose Check Selected.
How to read
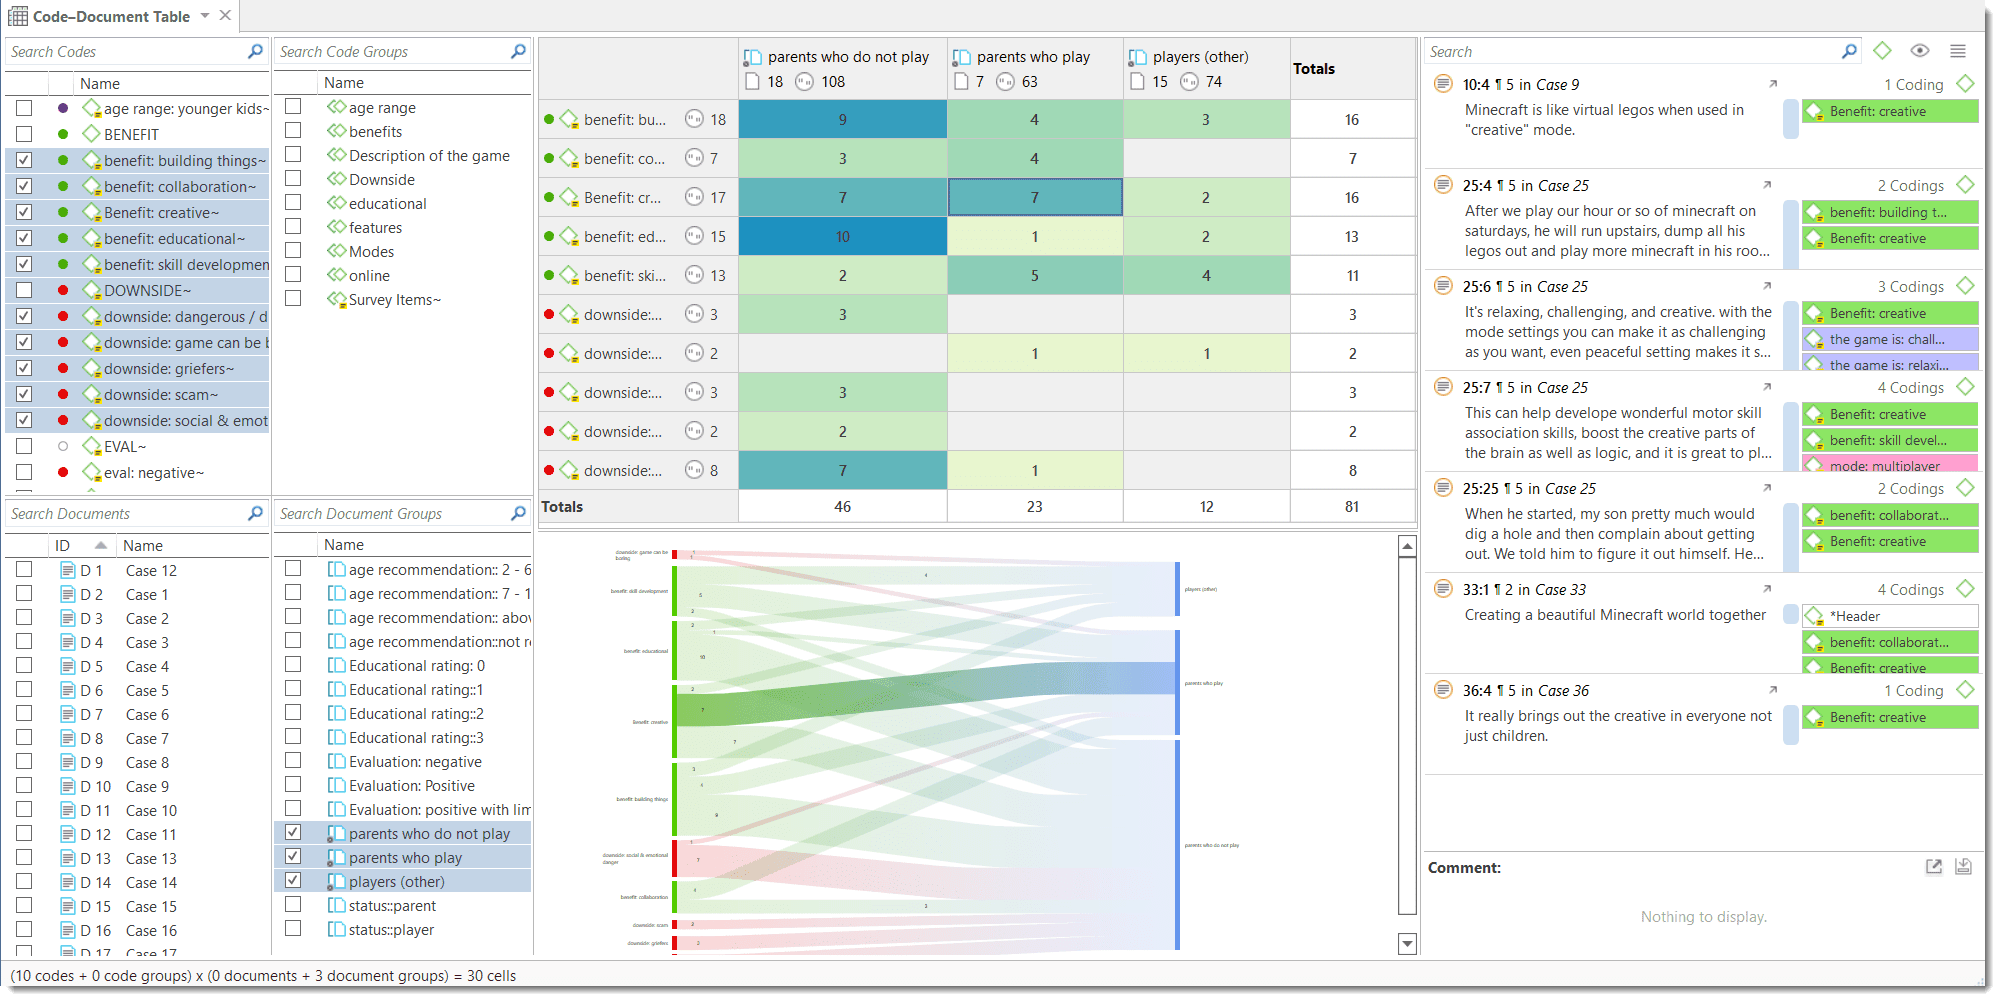
By default, the codes / code groups are displayed in the first column, and the documents / document groups in the first row. First column
-
Next to each code, the number indicates how often the code is applied in the entire project.
-
Next to a code group, you see two numbers: The first one tells you how many codes are in the group, the second numbers gives you the number of codings. This is different from the number of quotations, as multiple codes from the same code group could be linked to the same quotation.
First row
-
Below a document, you see the total number of quotations in each document.
-
Below a document group, you see two numbers: the first one tells you how many documents are in the document group, and the second number gives you the number of quotations for all documents in the group.
The additional information you get for each selected row or column item allows you to better evaluate the numbers inside the table cells. If the value in the table cell is 10, but the code overall was applied 100 times, this leads to a different interpretation as if the code was only applied 12 times in the entire project.
Table cells
-
The results in the table cells show how often each selected code was (or the codes of a code group were) applied in each document or document group. Counted are the number of codings, unless you select to count words (see options).
-
If you click on a cell in the table, the quotation content is shown in the Quotation Reader on the left-hand side.
Sankey Diagram
As soon as you create a table, a Sankey diagram will be shown in the area below the table. The Sankey diagram ist an alternative view complementing the original table view.
The basic table data model of rows and column entities is represented in the Sankey model as nodes and edges, the strength of co-occurrence between pairs of nodes. The Code Document table uses codes, code groups, documents and document groups. For each table cell containing a value, an edge is displayed between the diagram nodes. The thickness of the edges resemble the cell values of the table. Cells with value 0 are not displayed in a Sankey view.
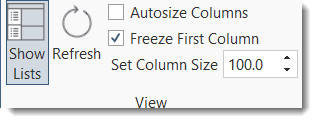
You can also view just the Sankey Diagram by deactivating the table in the ribbon.
 You find further information on how to work with Sankey diagrams here: Visualization of the Code-Document Tabel.