
The Code Co-Occurrence Table
The Co-occurrence analysis tool shows the frequencies of co-occurrence in a multitude of ways, for instance a matrix similar to a correlation matrix that you may know from statistical software, a Sankey diagram, or a force-directed graph.
The aim is to relate codes to each other that have been applied either to the same quotations or to overlapping quotations. You can find out which topics are mentioned together or are in proximity to each other. Thus, the results depend on how you have coded the data.
To open the tool, select Analysis > Code Co-occurrence Table.
Select one or multiple codes from the first list for table columns, and from the second list for the table rows. You can switch around the rows and codes after the table has been created (see Options).
To select an item, you need to click the check-box in front of it. It is also possible to select multiple items via the standard selection techniques using the cmd or shift keys. After highlighting multiple items, push the space bar to activate the checkboxes of all selected items.
You can also inspect co-occurrences from anywhere in the app by right-clicking codes and selecting one of the co-occurrence options in the Analysis submenu. This will open the same tool as described here, and make the appropriate selections.
You can switch view modes in the toolbar at the top. Different visualizations lend themselves to different analysis tasks, so play around with them.
The table approach reduces the analysis to a pairwise comparison. If you need a higher order co-occurrence you can use the category codes instead of the subcodes.
If you want to compare code co-occurrences within subsets of your data, you can set a document group as global filter
How to Read the Table
-
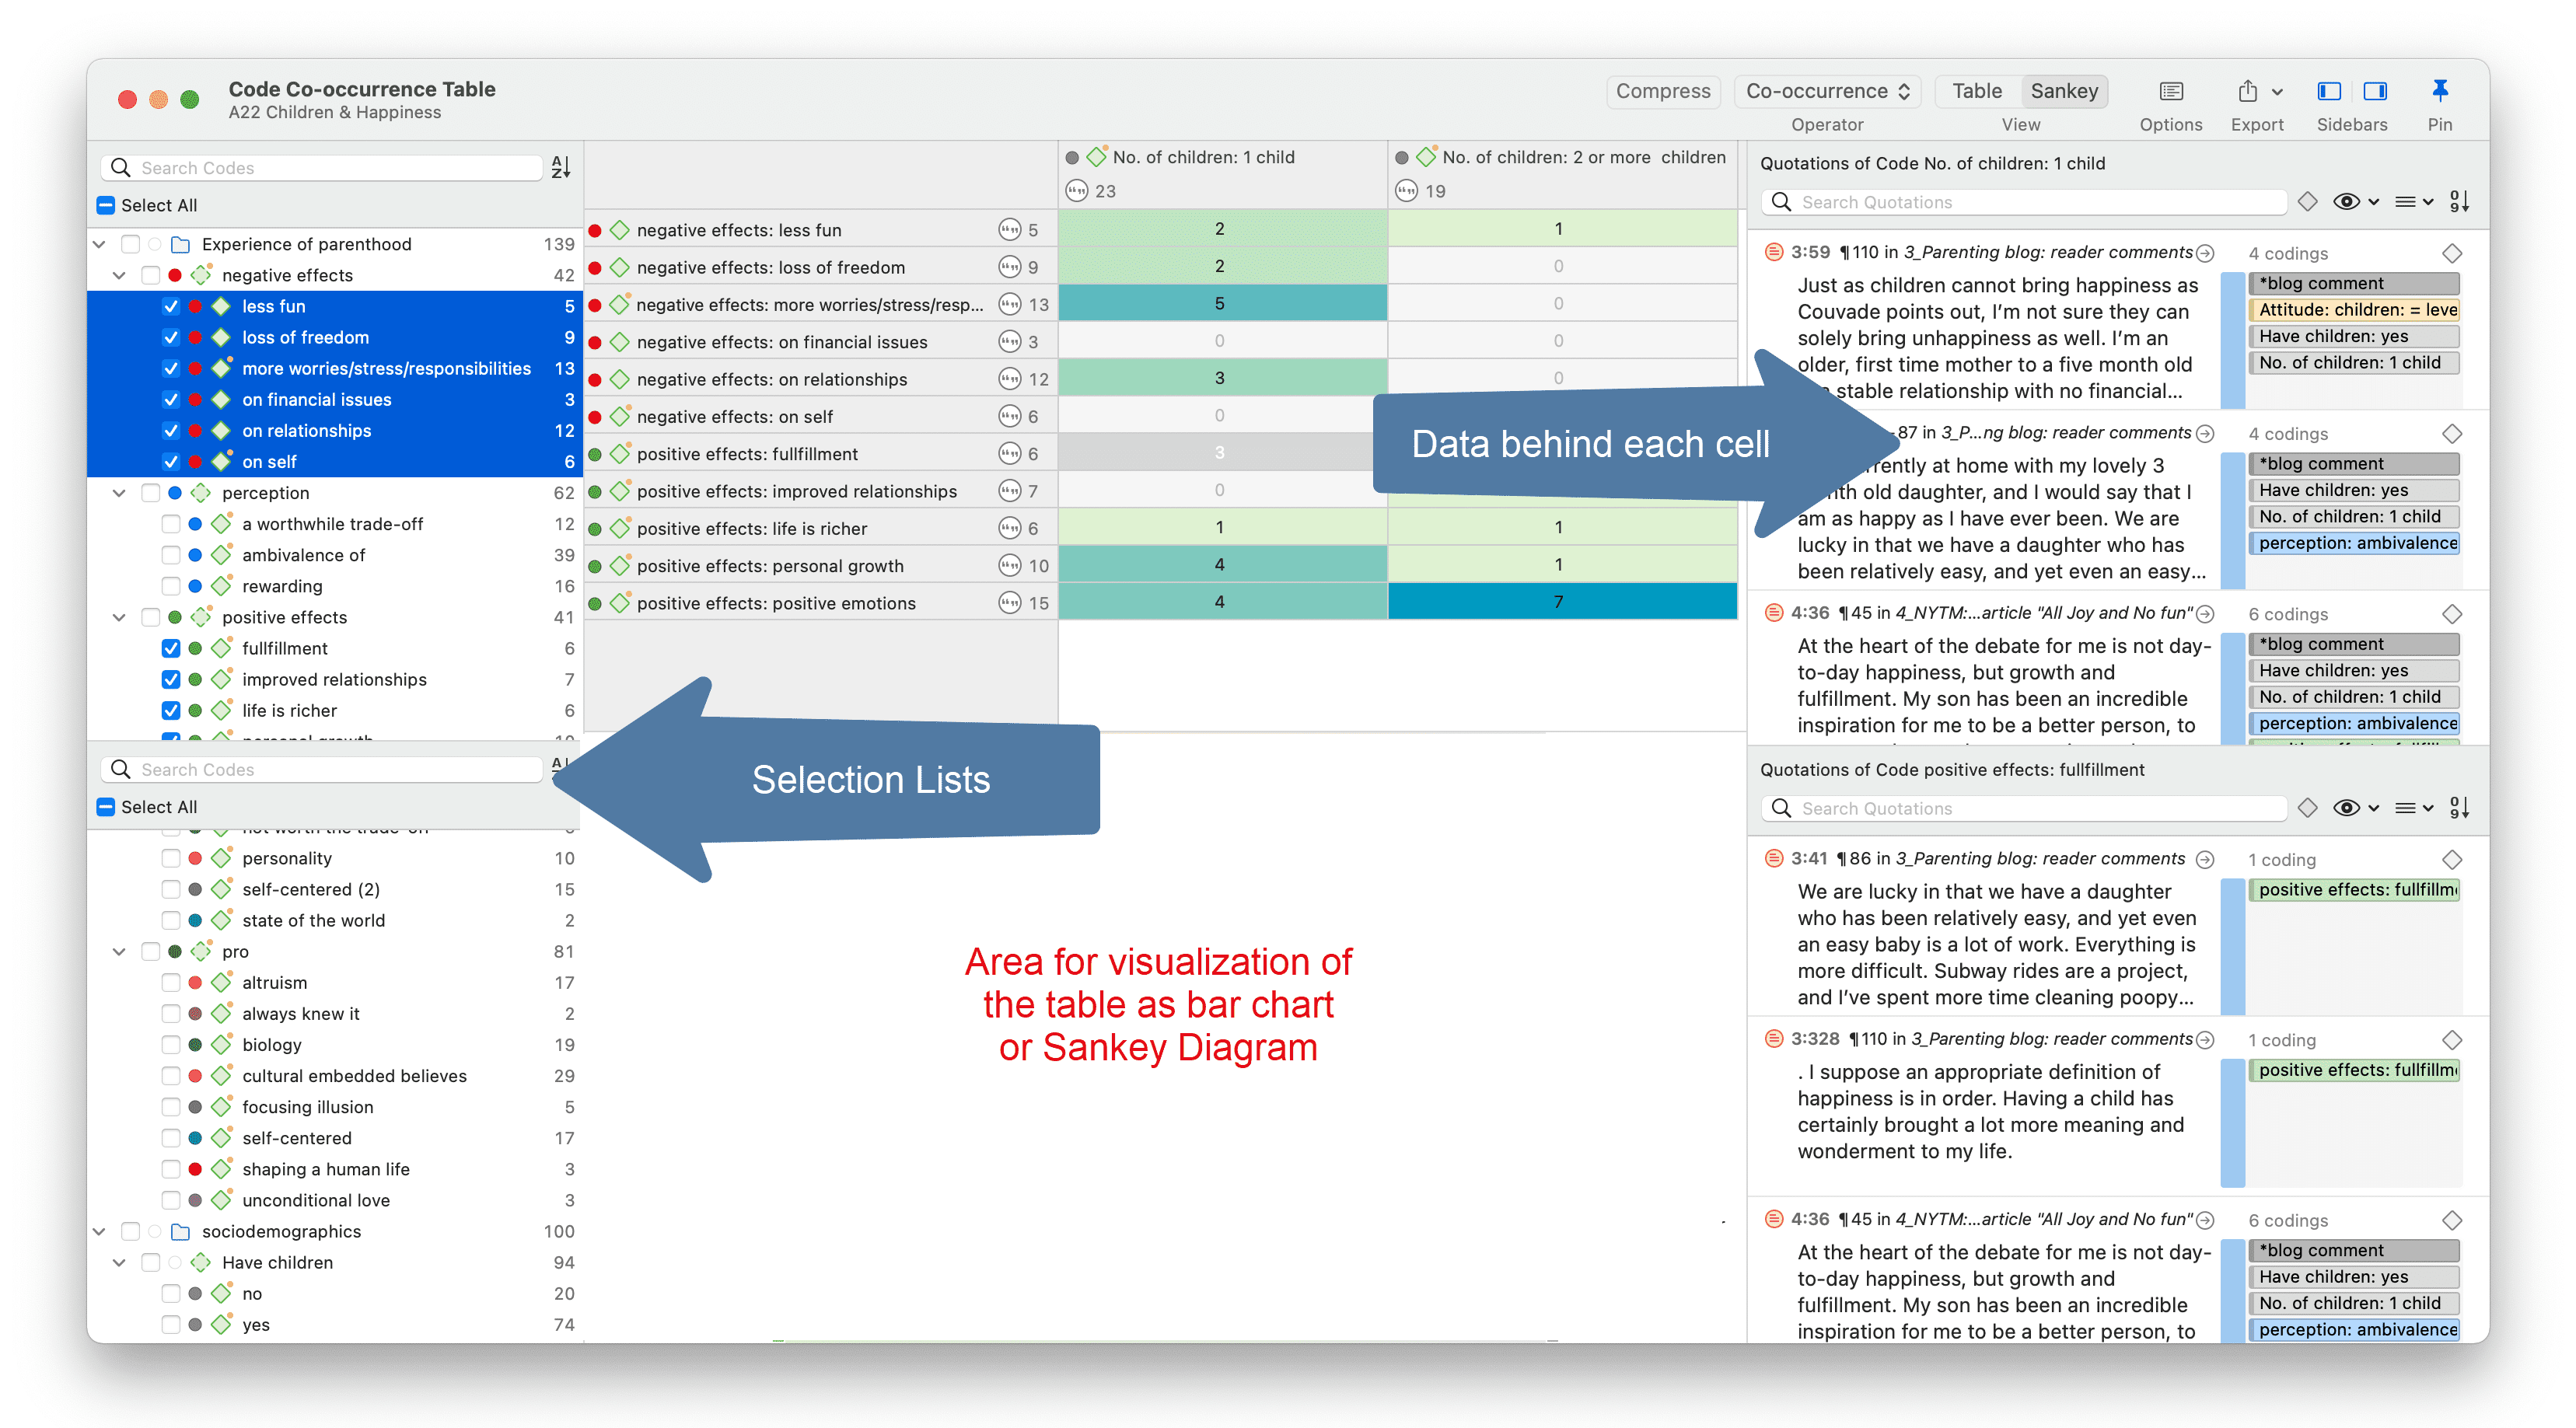
First column / first row: The number below and behind each code shows how often the code is applied the entire project. This helps you to better evaluate the number of co-occurrences in the table cells.
-
The number in the cell indicates the number of hits, how often the two code co-occur. This means that the number of co-occurring „events" and not the number of quotations are counted. If a single quotation is coded by two codes or if two overlapping quotations are coded by two codes, this counts in both cases as a single co-occurrence.
-
If you click on a cell, the quotations of the corresponding row and column codes are displayed next to the table in the Quotation Reader. The quotation reader here always displays two lists of quotations: the quotations of the column code, and the quotations of the row code.
Code Co-Occurrence Table Toolbar
Compress: This is a quick way to remove all rows or columns that only show empty cells. This is the same as manually deactivating codes that yield no results. Thus, you cannot decompress a table!
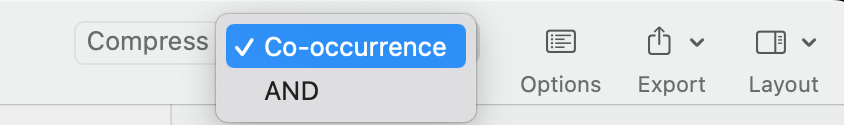
Operator: You can switch between the Co-occur and the AND operator. If the table cells should only show a result if the quotations overlap 100%, thus the two codes code exactly the same data segment, then select AND.
View Mode:
Table: Switch the view to show a table or matrix of co-occurrences.
Sankey: Switch view to a Sankey Diagram. See more in the chapter on co-occurrence visualization.
Bar Chart: View co-occurrences as a bar chart. See more in the chapter on co-occurrence visualization.
Force-Directed Graph: View co-occurrences as an interactive force-directed graph. See more in the chapter on co-occurrence visualization.
Options: See below.
Export: You can export the table as an Excel spreadsheet, or an image of the currently active visualization (including the table).
Table Export:
-
If Show Count is selected, only the number of co-occurrences are exported.
-
If Show Coefficient is selected, only the c-coefficient and not the absolute number of hits are exported.
-
If you have selected both, both are exported.
Code Co-Occurrence Layout Options
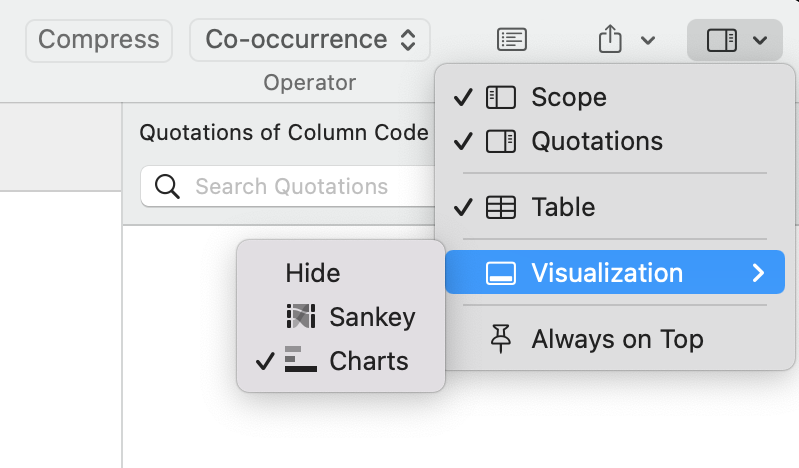
If you need more space on your screen, you can hide the two lists on the right- and left-hand side (scope and quotations).
If you want more room for the visualizations, you can hide the table.
The table visualization is available as Sankey diagram or barchart.
Code Co-Occurrence Table Options
To access the options, click the options button.
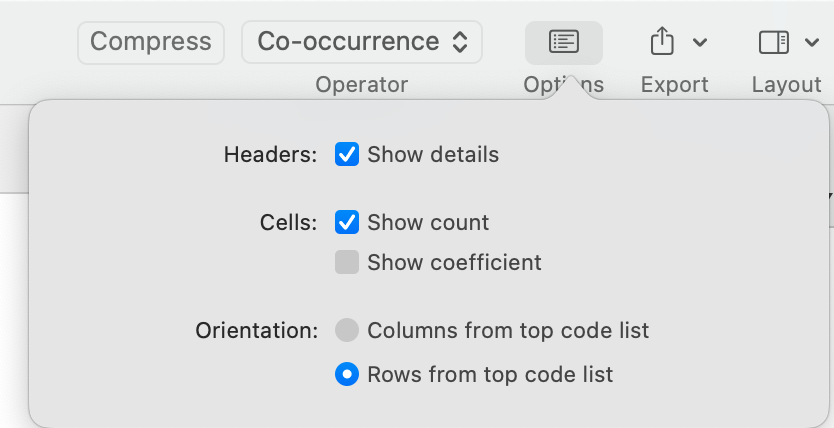
Show Details: If activated, you see the total number of times the code has been applied to a quotation. This helps you to better evaluate the numbers in each cell. The interpretation is likely different if the number of hits is 10 and if each of the codes have been applied 50 or only 15 times.
Show Count: The count shows the number of times two codes co-occur.
Show Coefficient: The c-coefficient gives an indication of the strength of the relationship between a pair of codes. See C-Coefficient for more detail.
Orientation: You can switch which codes are displayed as rows and columns: columns from top code list, or rows from top code list.