
The Code Co-Occurrence Table
Video Tutorial: Code Co-occurrence Tools and Analysis
The Co-occurrence Table in comparison to the Code Co-occurrence Explorer shows the frequencies of co-occurrence in form of a matrix similar to a correlation matrix that you may know from statistical software.
To open the tool, select Analysis > Code Co-occurrence Table.
Next you need to select the codes that you want to relate to each other:
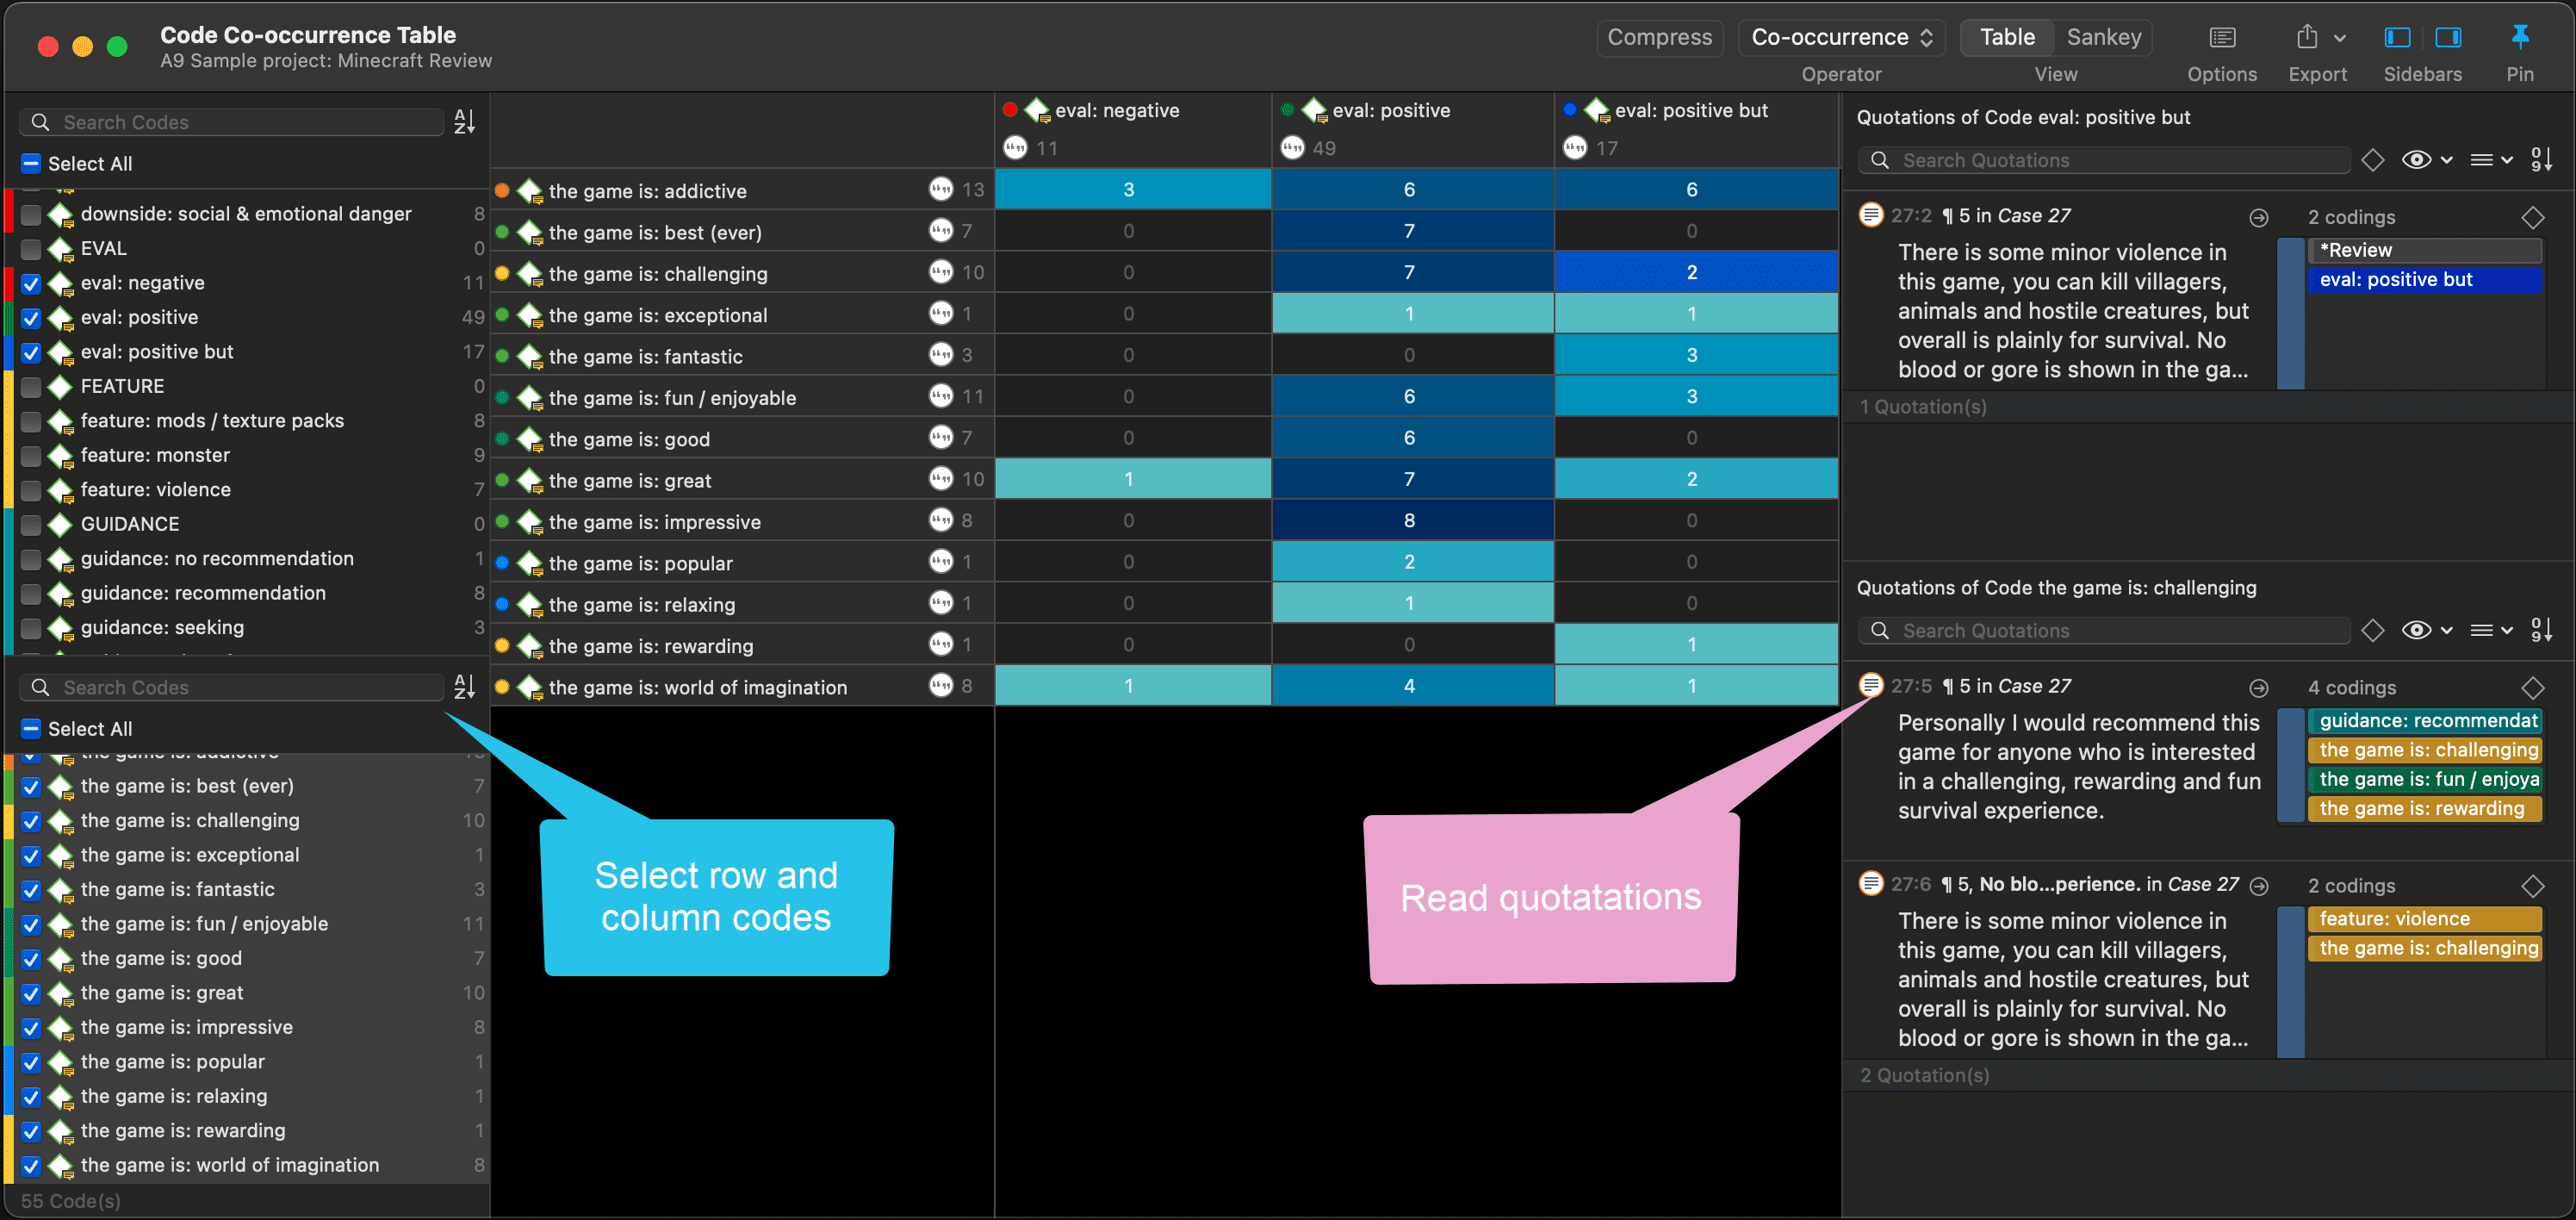
Select codes from the first list for the table columns, and codes from the second list for the table rows. To select an item, you need to click the check-box in front of it. It is also possible to select multiple items via the standard selection techniques using the cmd or shift-key. After highlighting multiple items, push the space bar to activate the checkboxes of all selected items.
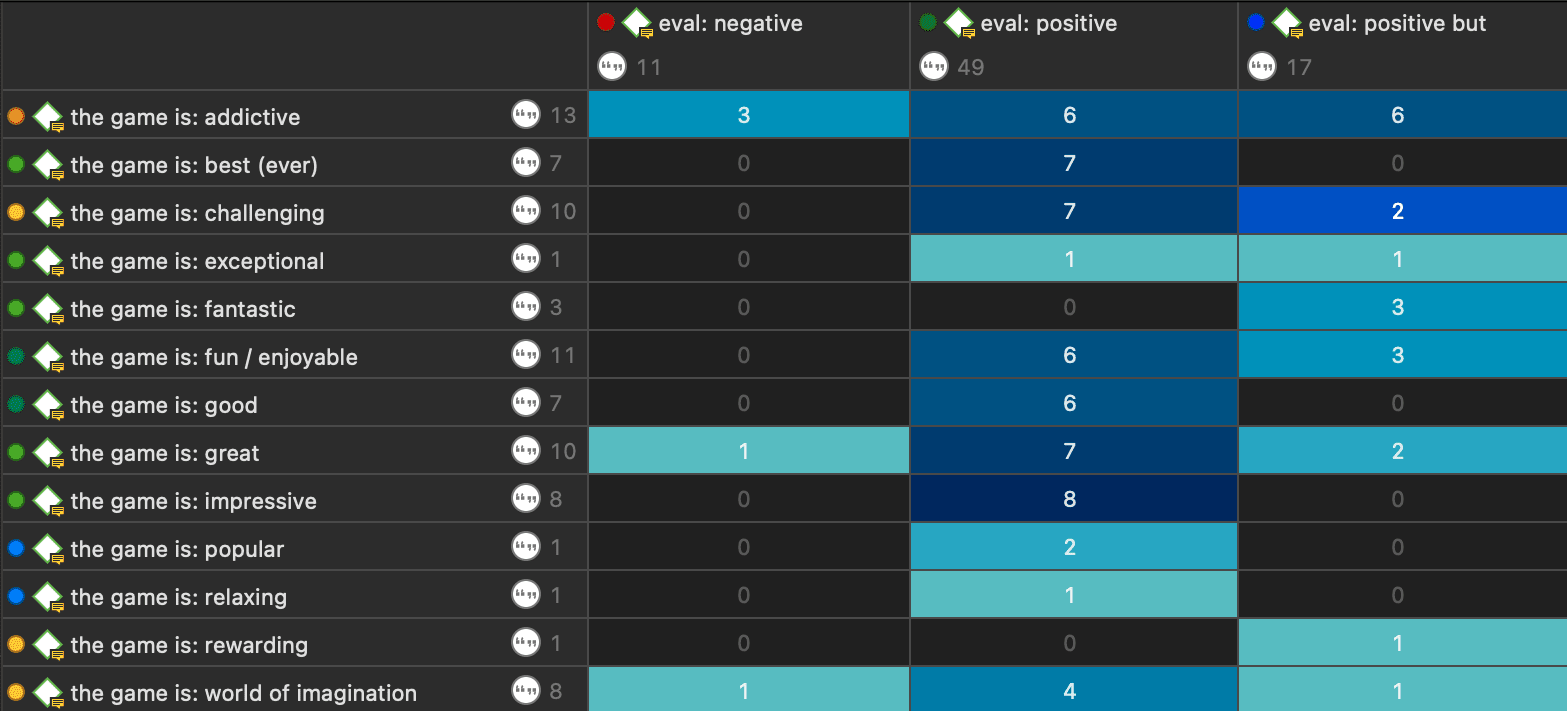
Code Co-occurrence Table in dark mode
How to Read the Table
-
First column / first row: The number below and behind each code shows how often the code is applied in the entire project. This helps you to better evaluate the number of co-occurrences in the table cells.
-
The number in the cell indicates the number of hits, how often the two code co-occur. This means that the number of co-occurring 'events' and not the number of quotations are counted. If a single quotation is coded by two codes or if two overlapping quotations are coded by two codes, this counts in both cases as a single co-occurrence.
Retrieving the qualitative data: If you click on a cell, the quotations of the corresponding row and column codes are displayed next to the table in the Quotation Reader.
The quotation reader always displays two lists of quotations: the quotations of the column code, and the quotations of the row code.
Code Co-Occurrence Table Toolbar
Compress: This is a quick way to remove all rows or columns that only show empty cells. This is the same as manually deactivating codes that yield no results. Thus, you cannot decompress a table!
Operator: You can switch between the Co-occur and the AND operator. If the table cells should only show a result if the quotations overlap 100%, thus the two codes code exactly the same data segment, then you can select AND :
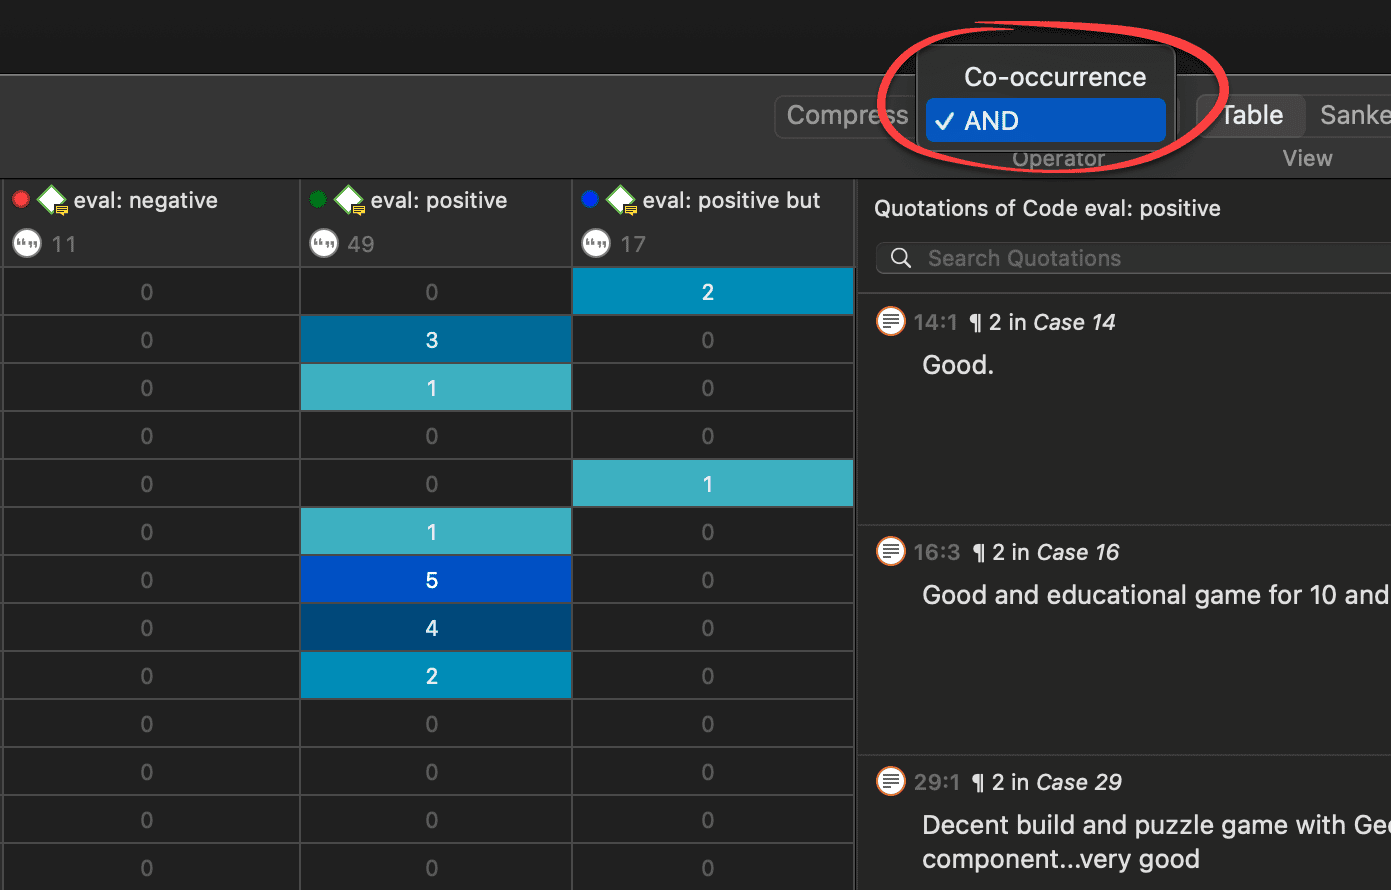
The table now only displays quotations that are coded by both the row and column codes
Table / Sankey: You can switch between table view, and a visualization of the selected data in form of a Sankey diagram.
Options: See below.
Export: You can export the table as Excel spreadsheet, and the Sankey diagram as image.
Table Export:
-
If Show Count is selected, only the number of co-occurrences are exported.
-
If Show Coefficient is selected, only the c-coefficient and not the absolute number of hits are exported.
-
If you have selected both, both are exported.
The table approach reduces the analysis to a pairwise comparison. If you need a higher order co-occurrence based on two or more codes, you can create smart codes and use them in the table.
Code Co-Occurrence Table Options
To access the options, click the options button.
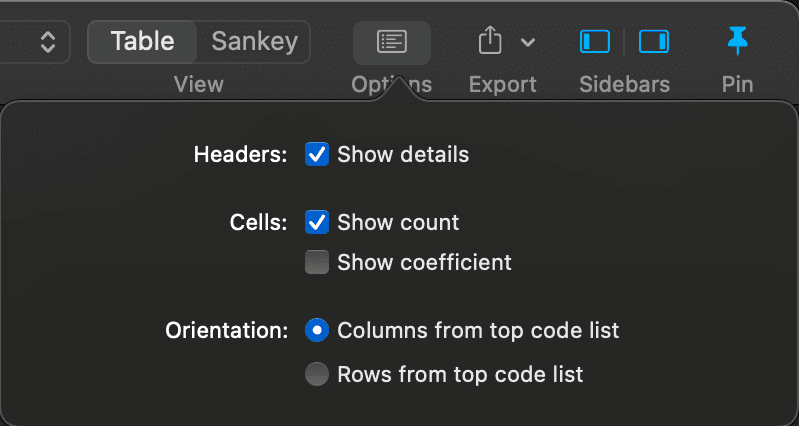
Show Details: If activated, you see the total number of times the code has been applied to a quotation. This helps you to better evaluate the numbers in each cell. The interpretation is likely different if the number of hits is 10 and if each of the codes have been applied 50 or only 15 times.
Show Count: The count shows the number of times two codes co-occur.
Show Coefficient: The c-coefficient gives an indication of the strength of the relationship between a pair of codes. See C-Coefficient for more detail.
Orientation: You can switch which codes are displayed as rows and columns: columns from top code list, or rows from top code list.