
ATLAS.ti Networks
Video Tutorial: Visualizations in Building the Understanding
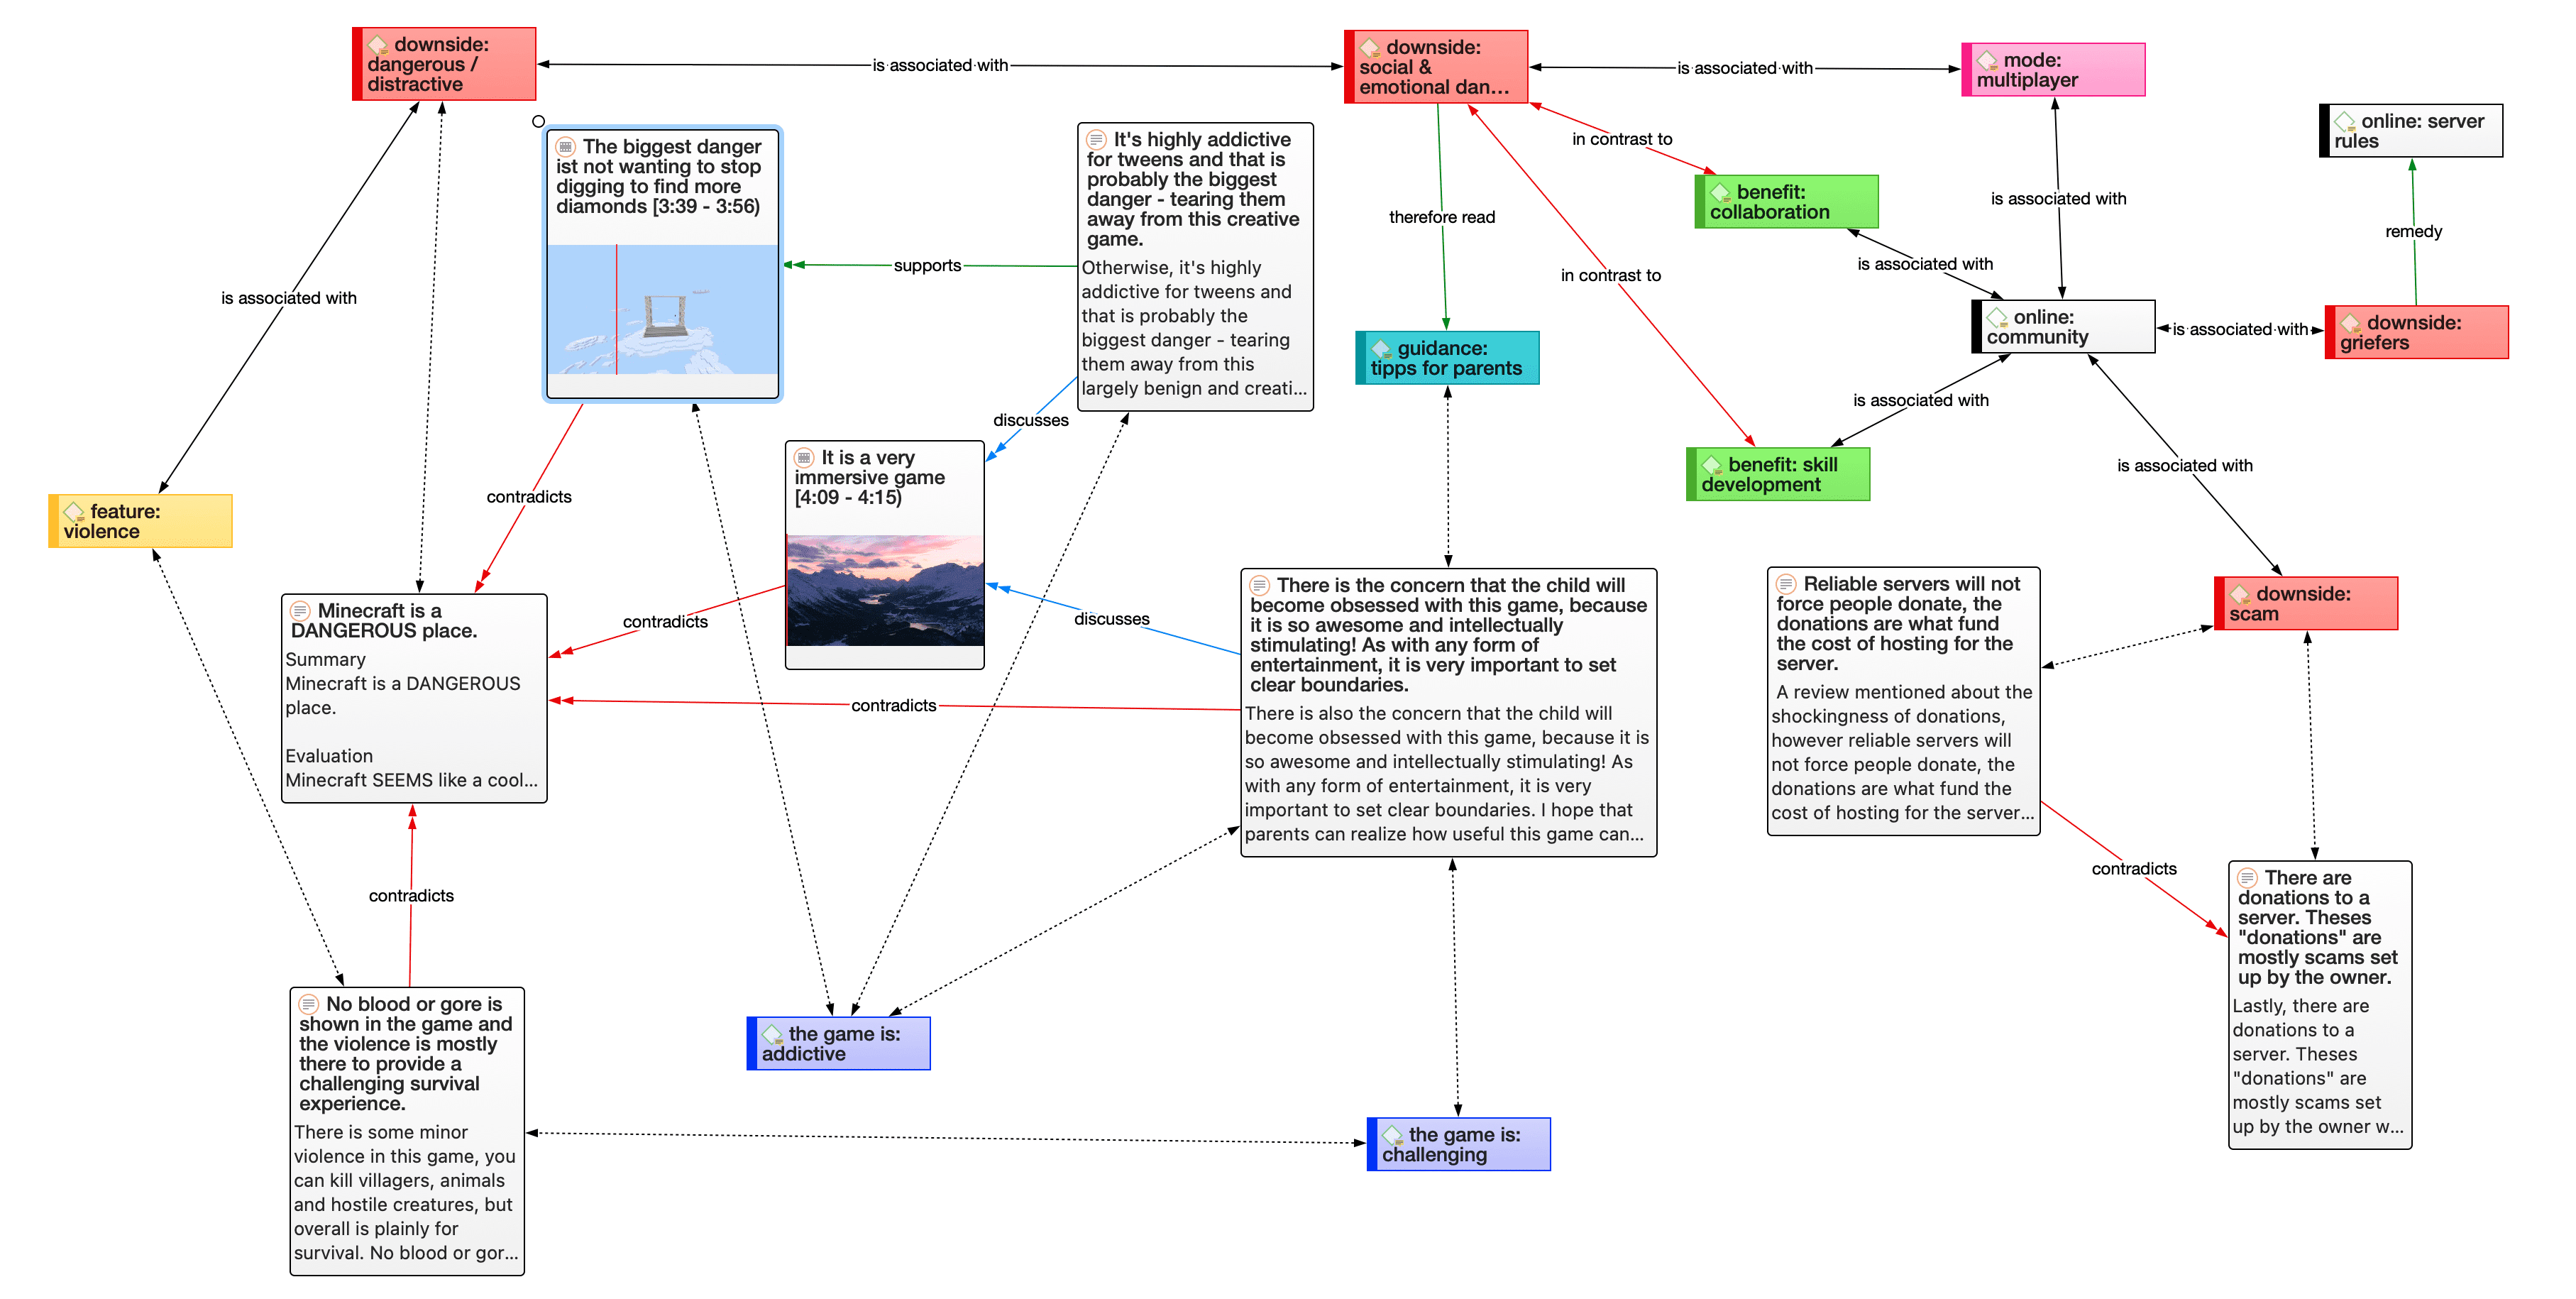
Visualization can be a key element in discovering connections between concepts, interpreting your findings, and effectively communicating your results. Networks in ATLAS.ti allow you to accomplish all three of these important objectives. These small segments of your larger web of analysis are modeled using the network editor, an intuitive work space we also like to think is easy on the eye.
The word network is a ubiquitous and powerful metaphor found in many fields of research and application. Flow charts in project planning, text graphs in hypertext systems, cognitive models of memory and knowledge representation (semantic networks) are all networks that serve to represent complex information by intuitively accessible graphic means. One of the most attractive properties of graphs is their intuitive graphical presentation, mostly in form of two-dimensional layouts of labeled nodes and links.
 In contrast with linear, sequential representations (e.g., text), presentations of knowledge in networks resemble more closely the way human memory and thought is structured. Cognitive "load" in handling complex relationships is reduced with the aid of spatial representation techniques. ATLAS.ti uses networks to help represent and explore conceptual structures. Networks add a heuristic "right brain" approach to qualitative analysis.
The user can manipulate and display almost all entities of a project as nodes in a network: quotations, codes, code group, memos, memo groups, other networks, documents, document groups and all smart entities.
If you are interested in learning more about network theory and how it is applied in ATLAS.ti, you can watch the following video: Did you ever wonder what's behind the ATLAS.ti network function.