
Methods For Testing ICA
“An inter-coder agreement coefficient measures the extent to which data can be trusted to represent the phenomena of analytical interest that one hopes to analyze in place of the raw phenomena” (Krippendorff, 2019).
ATLAS.ti currently offers three methods to test inter-coder agreement:
-
Simple percent agreement
-
Holsti Index
-
Krippendorff's family of alpha coefficients.
All methods can be used for two or more coders. As the percent agreement measure, and the Holsti index do not take into account chance agreement, we recommend the Krippendorff alpha coefficients for scientific reporting.
Percent Agreement
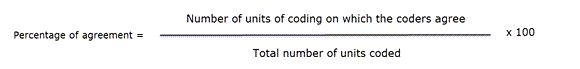
Percentage Agreement is the simplest measure of inter-coder agreement. It is calculated as the number of times a set of ratings are the same, divided by the total number of units of observation that are rated, multiplied by 100.
The benefits of percentage agreement are that it is simple to calculate, and it can be used with any type of measurement scale. Let's take a look at the following example: There are ten segments of text and two coders only needed to decide whether a code applies or does not apply:
Example Coding of Two Coders
| Segments | 1 | 2 | 3 | 4 | 5 | 6 | 7 | 8 | 9 | 10 |
|---|---|---|---|---|---|---|---|---|---|---|
| Coder 1 | 1 | 1 | 0 | 0 | 0 | 0 | 0 | 0 | 0 | 0 |
| Coder 2 | 0 | 1 | 1 | 0 | 0 | 1 | 0 | 1 | 0 | 0 |
1 = agreement, 0 = disagreement
This is how you calculate it:
 PA = 6 / 10
PA = 0.6 = 60%
Coder 1 and 2 agree 6 out of 10 times, so percent agreement is 60%.
One could argue that this is quite good. This calculation, however, does not account for chance agreement between ratings. If the two coders were not to read the data and would just randomly coding the 10 segments. we would expect them to agree a certain percentage of the time by chance alone. The question is: How much higher is the 60% agreement over the agreement that would occur by chance?
The agreement that is expected by mere chance is 56% = (9.6 +1.6)/20. If you are interested in the calculation, take a look at Krippendorff (2004, p. 224-226. The 60% agreement now does not look so impressive after all. Statistically speaking, the performance of the two coders is equivalent to having arbitrarily assigned 0s and 1s to 9 of the 10 segments, and only 1 of the 10 segments is reliably coded.
For calculating percent agreement you can add single codes in place of semantic domains.
Holsti Index
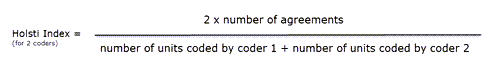
The Holsti index (Holsti, 1969) is a variation of the percent agreement measure for situations where coders do not code precisely the same data segment. This is the case if coders set their own quotations/. Like Percent Agreement, also the Holsti index does not take into account chance agreement.
The formula for the Holsti Index is:
 The results for Percentage agreement and the Holsti Index are the same when all coders code the same data segments.
For calculating percent agreement you can add single codes in place of a semantic domain, or use real semantic domains.
Cohe
We acknowledge that Cohen’s Kappa is a popular measure, but we opted for not implementing it because of the limitations identified in the literature.
*"It is quite puzzling why Cohen’s kappa has been so popular in spite of so much controversy with it. Researchers started to raise issues with Cohen’s kappa more than three decades ago (Kraemer, 1979; Brennan & Prediger, 1981; Maclure & Willett, 1987; Zwick, 1988; Feinstein & Cicchetti, 1990; Cicchetti & Feinstein, 1990; Byrt, Bishop & Carlin, 1993). In a series of two papers, Feinstein & Cicchetti (1990) and Cicchetti & Feinstein (1990) made the following two paradoxes with Cohen’s kappa well-known: (1) A low kappa can occur at a high agreement; and (2) Unbalanced marginal distributions produce higher values of kappa than more balanced marginal distributions. While the two paradoxes are not mentioned in older textbooks (e.g. Agresti, 2002), they are fully introduced as the limitations of kappa in a recent graduate textbook (Oleckno, 2008). On top of the two well-known paradoxes aforementioned, Zhao (2011) describes twelve additional paradoxes with kappa and suggests that Cohen’s kappa is not a general measure for interrater reliability at all but a measure of reliability under special conditions that are rarely held.
Krippendorff (2004) suggests that Cohen’s Kappa is not qualified as a reliability measure in reliability analysis since its definition of chance agreement is derived from association measures because of its assumption of raters’ independence. He argues that in reliability analysis raters should be interchangeable rather than independent and that the definition of chance agreement should be derived from estimated proportions as approximations of the true proportions in the population of reliability data. Krippendorff (2004) mathematically demonstrates that kappa’s expected disagreement is not a function of estimated proportions from sample data but a function of two raters’ individual preferences for the two categories."* (Xie, 2013).
In addition, Cohen's kappa can only be used for 2 coders, and it assumes an infinite sample size. See also the article in our research blog: Why Cohen's Kappa is not a good choice.
Krippendorff's Family of Alpha Coefficients
The family of alpha coefficients offers various measurement that allow you to carry out calculations at different levels. They can be used for more than two coders, are sensitive to different sample sizes and can be used with small samples as well.
Alpha binary
At the most general level, you can measure whether different coders identify the same sections in the data to be relevant for the topics of interest represented by codes. All text units are taken into account for this analysis, coded as well as not coded data.
You can, but do not need to use semantic domains at this level. It is also possible to enter a single code per domain. You get a value for alpha binary for each code (or each semantic domain) in the analysis, and a global value for all codes (or all domains) in the analysis.
The global alpha binary value might be something you want to publish in a paper as an overall value for inter-coder agreement for your project.
The values for each code or semantic domain provide feedback which of the codes / domains are satisfactory in terms of inter-coder agreement, and which are understood in different ways by the different coders. These are codes / domains you need to improve and test gain, albeit with different coders.
If you work with pre-defined quotations, the binary coefficient will be 1 for a semantic domain if only codes of the same semantic domain have been applied, regardless which code within the domain has been applied.
The value for global alpha binary will always be 1 when working with pre-defined quotations as all coded segments are the same.
cu-alpha
The cu-alpha/Cu-alpha coefficients can only be used on combination with semantic domains. They cannot be used to test agreement/disagreement for single codes!
Another option is to test whether different coders were able to distinguish between the codes of a semantic domain. For example, if you have a semantic domain called 'type of emotions' with the sub codes:
- emotions::contentment
- emotions::excitement
- emotions::embarrassment
- emotions::relief
The coefficient gives you an indication whether the coders were able to reliably distinguish between for instance 'contentment' and 'excitement', or between 'embarrassment' and 'relief'. The cu-alpha will give you a value for the overall performance of the semantic domain. It will however not tell you which of the sub codes might be problematic. You need to look at the quotations and check where the confusion is.
The cu-alpha coefficient can only be calculated if the codes of a semantic domain have been applied in a mutually exclusive manner. This means only one of the sub codes per domain is applied to a given quotation. See also Requirements for Coding.
Cu-alpha
Cu-alpha is the global coefficient for all cu-alphas. It takes into account that you can apply codes from multiple semantic domains to the same or overlapping quotations. See multivalued coding. Thus, Cu-alpha is not just the average of all cu-alphas.
If codes of a semantic domain 'A' have been applied to data segments that are coded with codes of a semantic domain 'B', this does not affect the cu-alpha coefficient for either domain A or B, but it effects the overall Cu-alpha coefficient.
You can interpret the Cu-alpha coefficient as indicating the extent to which coders agree on the presence or absence of the semantic domains in the analysis. Formulated as a question: Could coders reliably identify that data segments belong to a specific semantic domain, or did the various coders apply codes from other semantic domains?
In the calculation for both the cu- and Cu-alpha coefficient, only coded data segments are included in the analysis.
Calculation of Krippendorff's Alpha
For a full mathematical explanation on how the alpha coefficients are calculated see ICA Appendix.
The basic formula for all Krippendorff alpha coefficients is as follows:
alpha = 1 - observed disagreement (Do)) / expected disagreement (De)
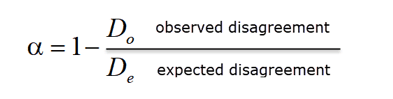 whereby 'De' is the expected disagreement by chance.
α = 1 indicates perfect reliability. α = 0 indicates the absence of reliability. The units and the values assigned to them are statistically unrelated. α < 0 when disagreements are systematic and exceed what can be expected by chance.
When coders pay no attention to the text, which means they just apply the codes arbitrarily, their coding has no relationship to what the text is about, then the observed disagreement is 1. In other words, the observed disagreement (Do) equals the maximum expected disagreement (De), which is 1. If we enter this in the formula, we get:
α= 1 – 1/1 = 0.000.
If on the other hand, agreement is perfect, which means observed disagreement (Do) = 0, then we get:
α= 1 – 0 / expected disagreement = 1.000.
To better understand the relationship between actual, observed and expected agreement, let's take a look at the following contingency table:
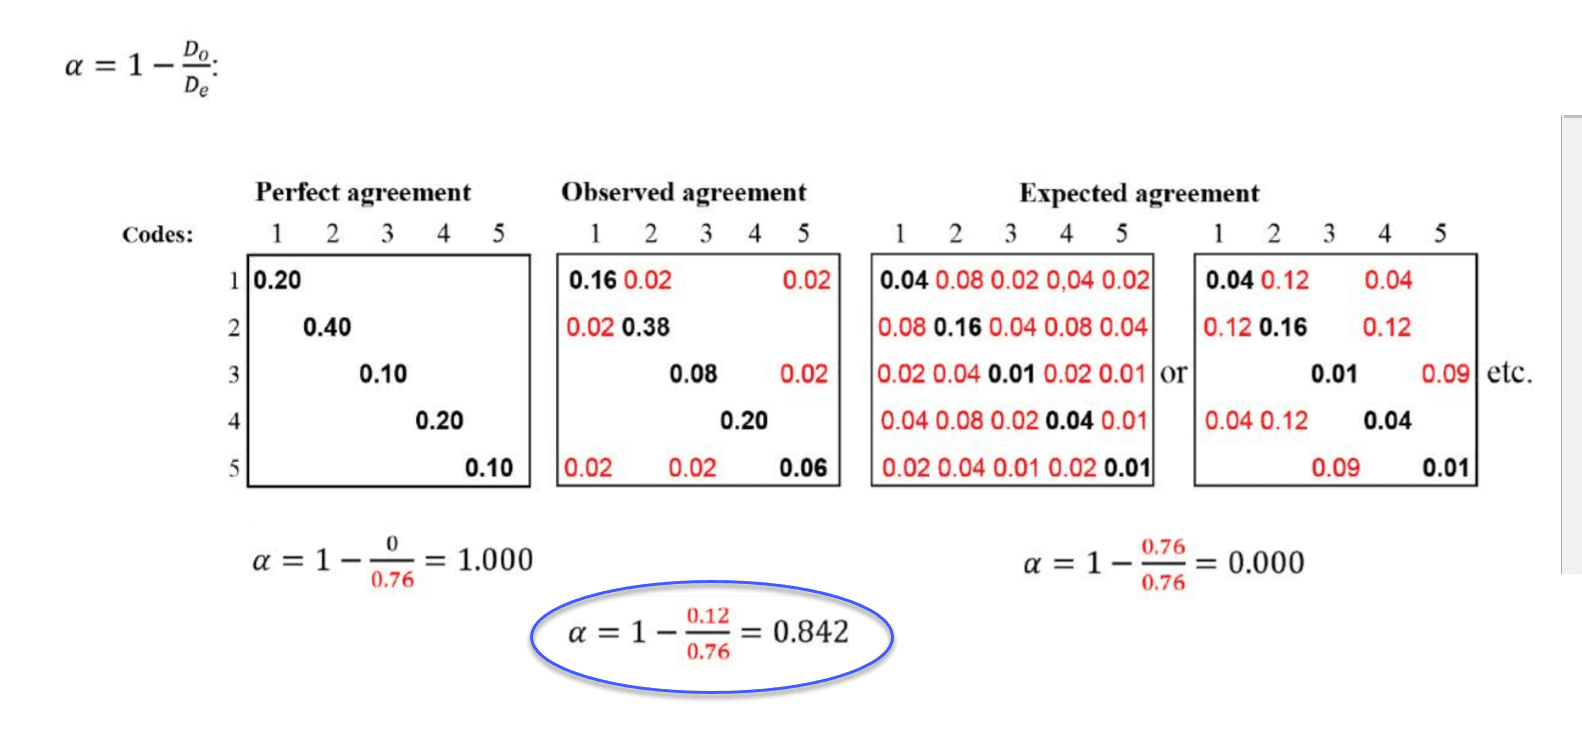 In the example above, the tables represent a semantic domain with five codes. The matrices with perfect and expected agreement/disagreement serve as a benchmark what could have been if agreement either was perfect or if coders had applied the codes randomly. There are two matrices for expected agreement/disagreement indicating that statistically speaking there are many possibilities for a random attribution of the codes.
The black numbers show agreement, the red numbers disagreement.
In the contingency table for observed agreement, we can see that the coders agree in applying code 4. There are no red numbers, thus no disagreement.
There is some disagreement about the application of code 2. Agreement is 38% percent. In 2 % of the cases, code 1 was applied instead of code 2.
There is a bit more confusion regarding the application of code 5. The coders have also applied code 1 and code 3.
If this were a real life example, you would take a look at the code definitions for code 5 and code 2 and ask yourself why coders had difficulties to apply these codes in a reliable manner. The coefficient, however, is acceptable. See Decision Rules.) There is no need for re-testing.
References
Banerjee, M., Capozzoli, M., McSweeney, L., Sinha, D. (1999). Beyond kappa: A review of interrater agreement measures. The Canadian Journal of Statistics, Vol. 27 (1), 3-23.]
Cohen, Jacob (1960). A coefficient of agreement for nominal scales. Educational and Psychological Measurement. 20 (1): 37–46. doi:10.1177/001316446002000104.
Holsti, O. R. (1969). Content analysis for the social sciences and humanities, Reading, MA: Addison-Wesley.
Krippendorff, Klaus (2004/2012/2018). Content Analysis: An Introduction to Its Methodology. 2ed /3rd /4th edition. Thousand Oaks, CA: Sage.
Zwick, Rebecca (1988). Another look at interrater agreement. Psychological Bulletin, 103, 347-387.
Xie, Q. (2013). Agree or disagree? A demonstration of an alternative statistic to cohens kappa for measuring the extent and reliability of agreement between observer. In Proceedings of the Federal Committee on Statistical Methodology Research Conference, The Council of Professional Associations on Federal Statistics, Washington, DC, USA, 2013.