
Code-Document Table
Video Tutorial: Working with the Code-Document Table
You can use the Code-Document Table for within and across documents or group comparisons by relating codes or code groups and documents or document groups to each other.
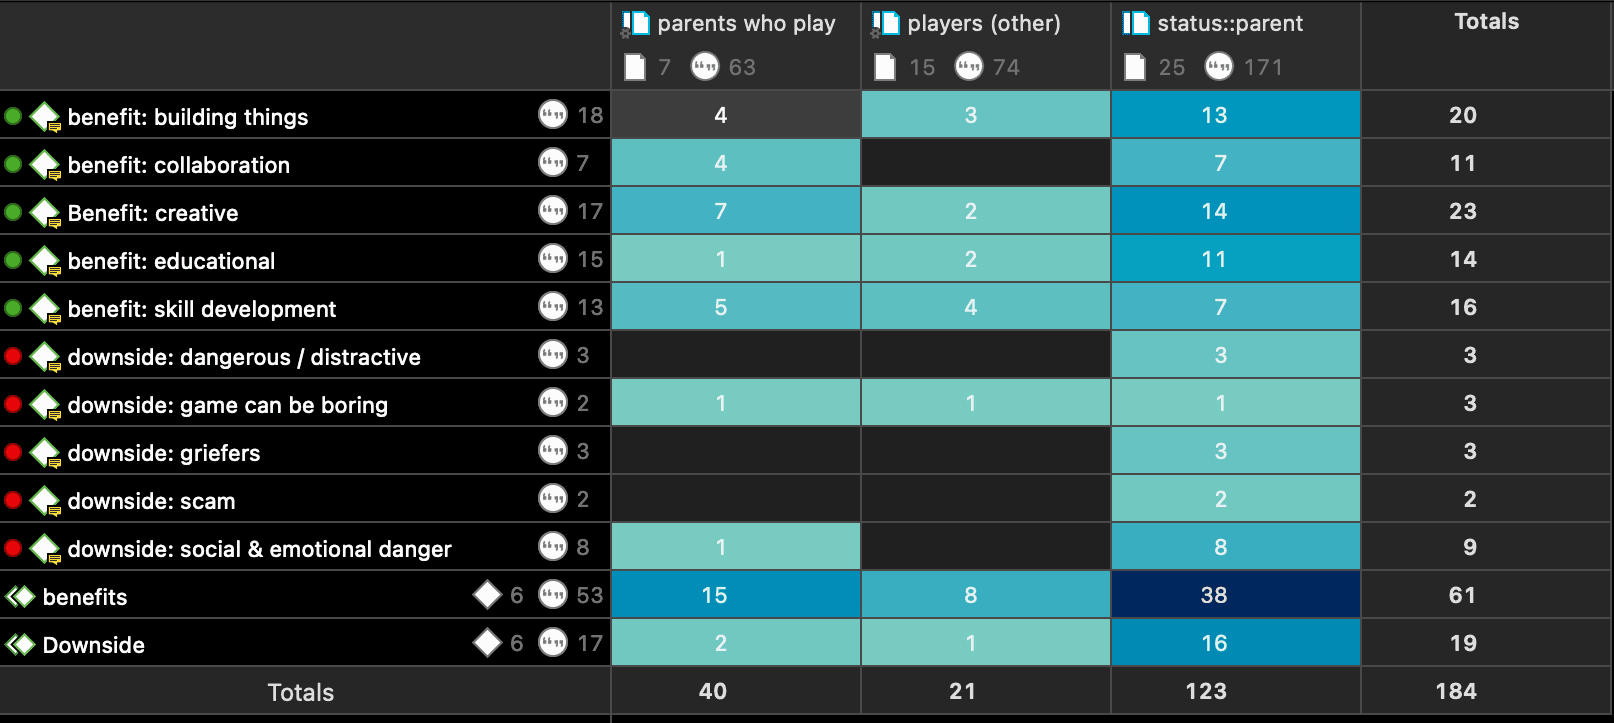
The table cells may contain either:
- the frequency count of the number of codings. This can be different from the number of quotations, if a quotation is coded by multiple codes. Counted is each link between a code and a quotation.
or
- the word count of the quotations coded by the selected code or code group.
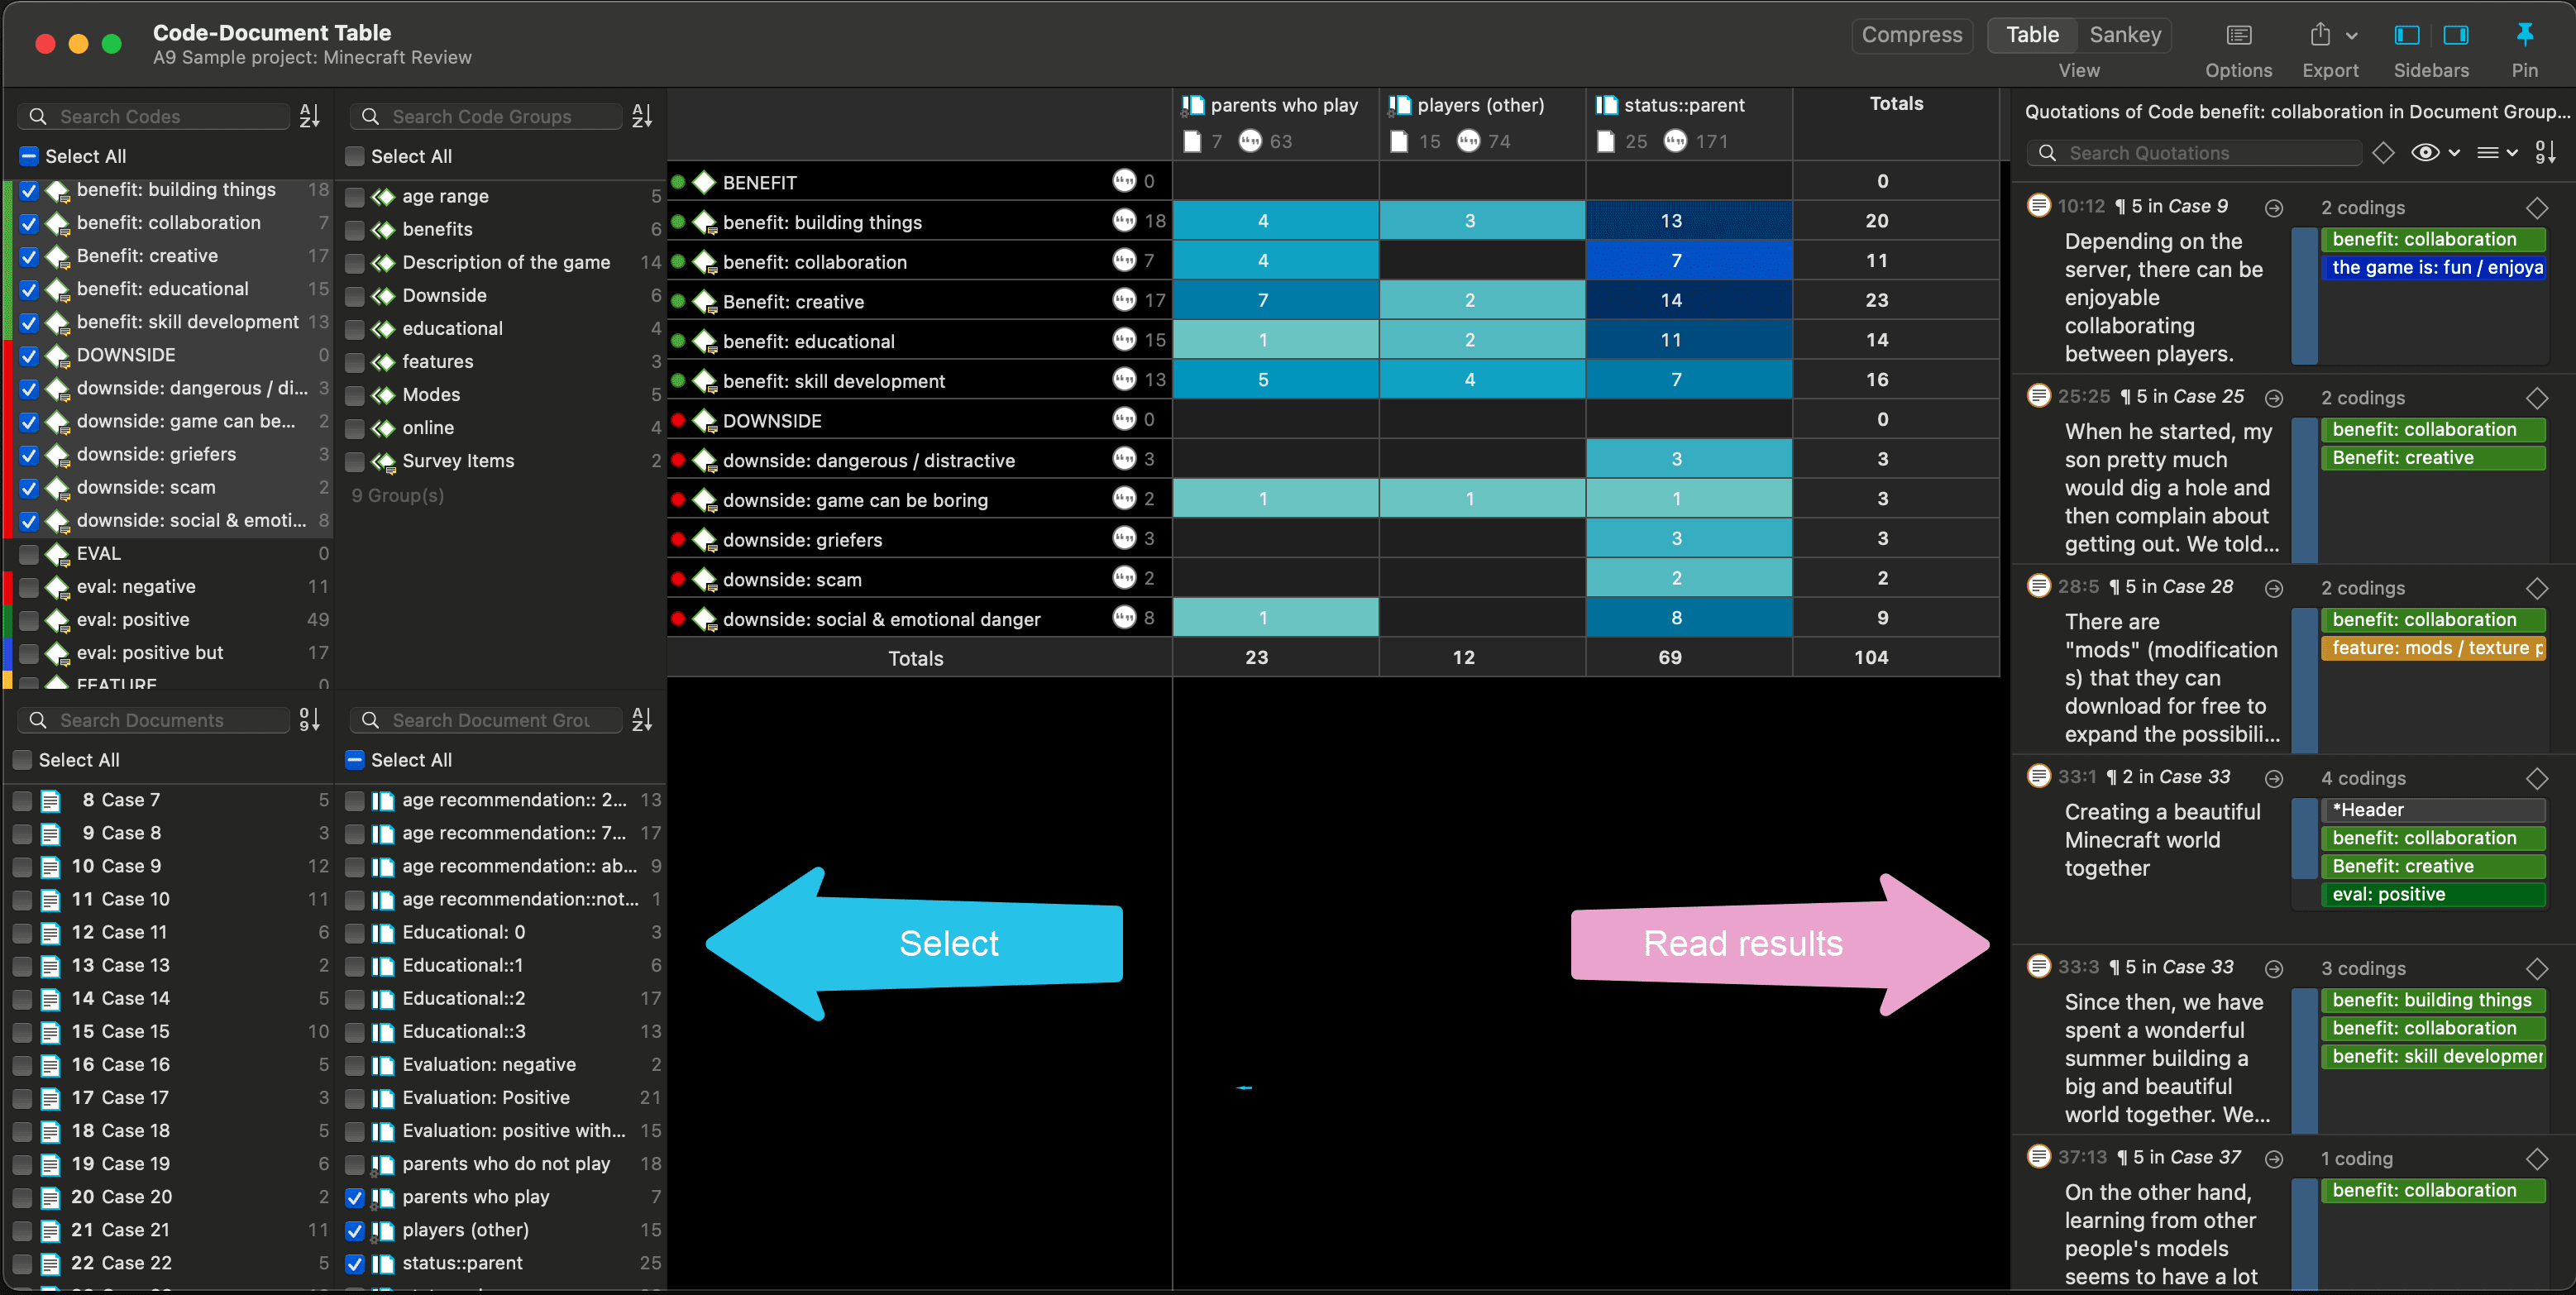
Code-Document Table
From the main menu select Analysis > Code-Document Table.
Select codes or code groups for the table rows; and select documents or document groups for the table columns.
How to make selections: To select an item, you need to click the check-box in front of it. It is also possible to select multiple items via the standard selection techniques using the cmd or shift-key. After highlighting multiple items, push the space bar to activate the check boxes of all selected items.
Code-Document Table in dark mode
How to read the table
By default, the codes / code groups are displayed in the left column, and the documents / document groups in the top row.
Left column
-
Next to each code, the number indicates how often the code is applied in the entire project.
-
Next to a code group, you see two numbers: The first one tells you how many codes are in the group, the second numbers gives you the number of codings. This is different from the number of quotations, as multiple codes from the same code group could be linked to the same quotation.
Top row
-
Below a document, you see the total number of quotations in each document.
-
Below a document group, you see two numbers: the first one tells you how many documents are in the document group, and the second number gives you the number of quotations for all documents in the group.
The additional information you get for each selected row or column item allows you to better evaluate the numbers inside the table cells. If the value in the table cell is 10, but the code overall was applied 100 times, this leads to a different interpretation as if the code was only applied 12 times in the entire project.
Table cells
-
The results in the table cells show how often each selected code was (or the codes of a code group were) applied in each document or document group. Counted are the number of codings, unless you select to count words (see options).
-
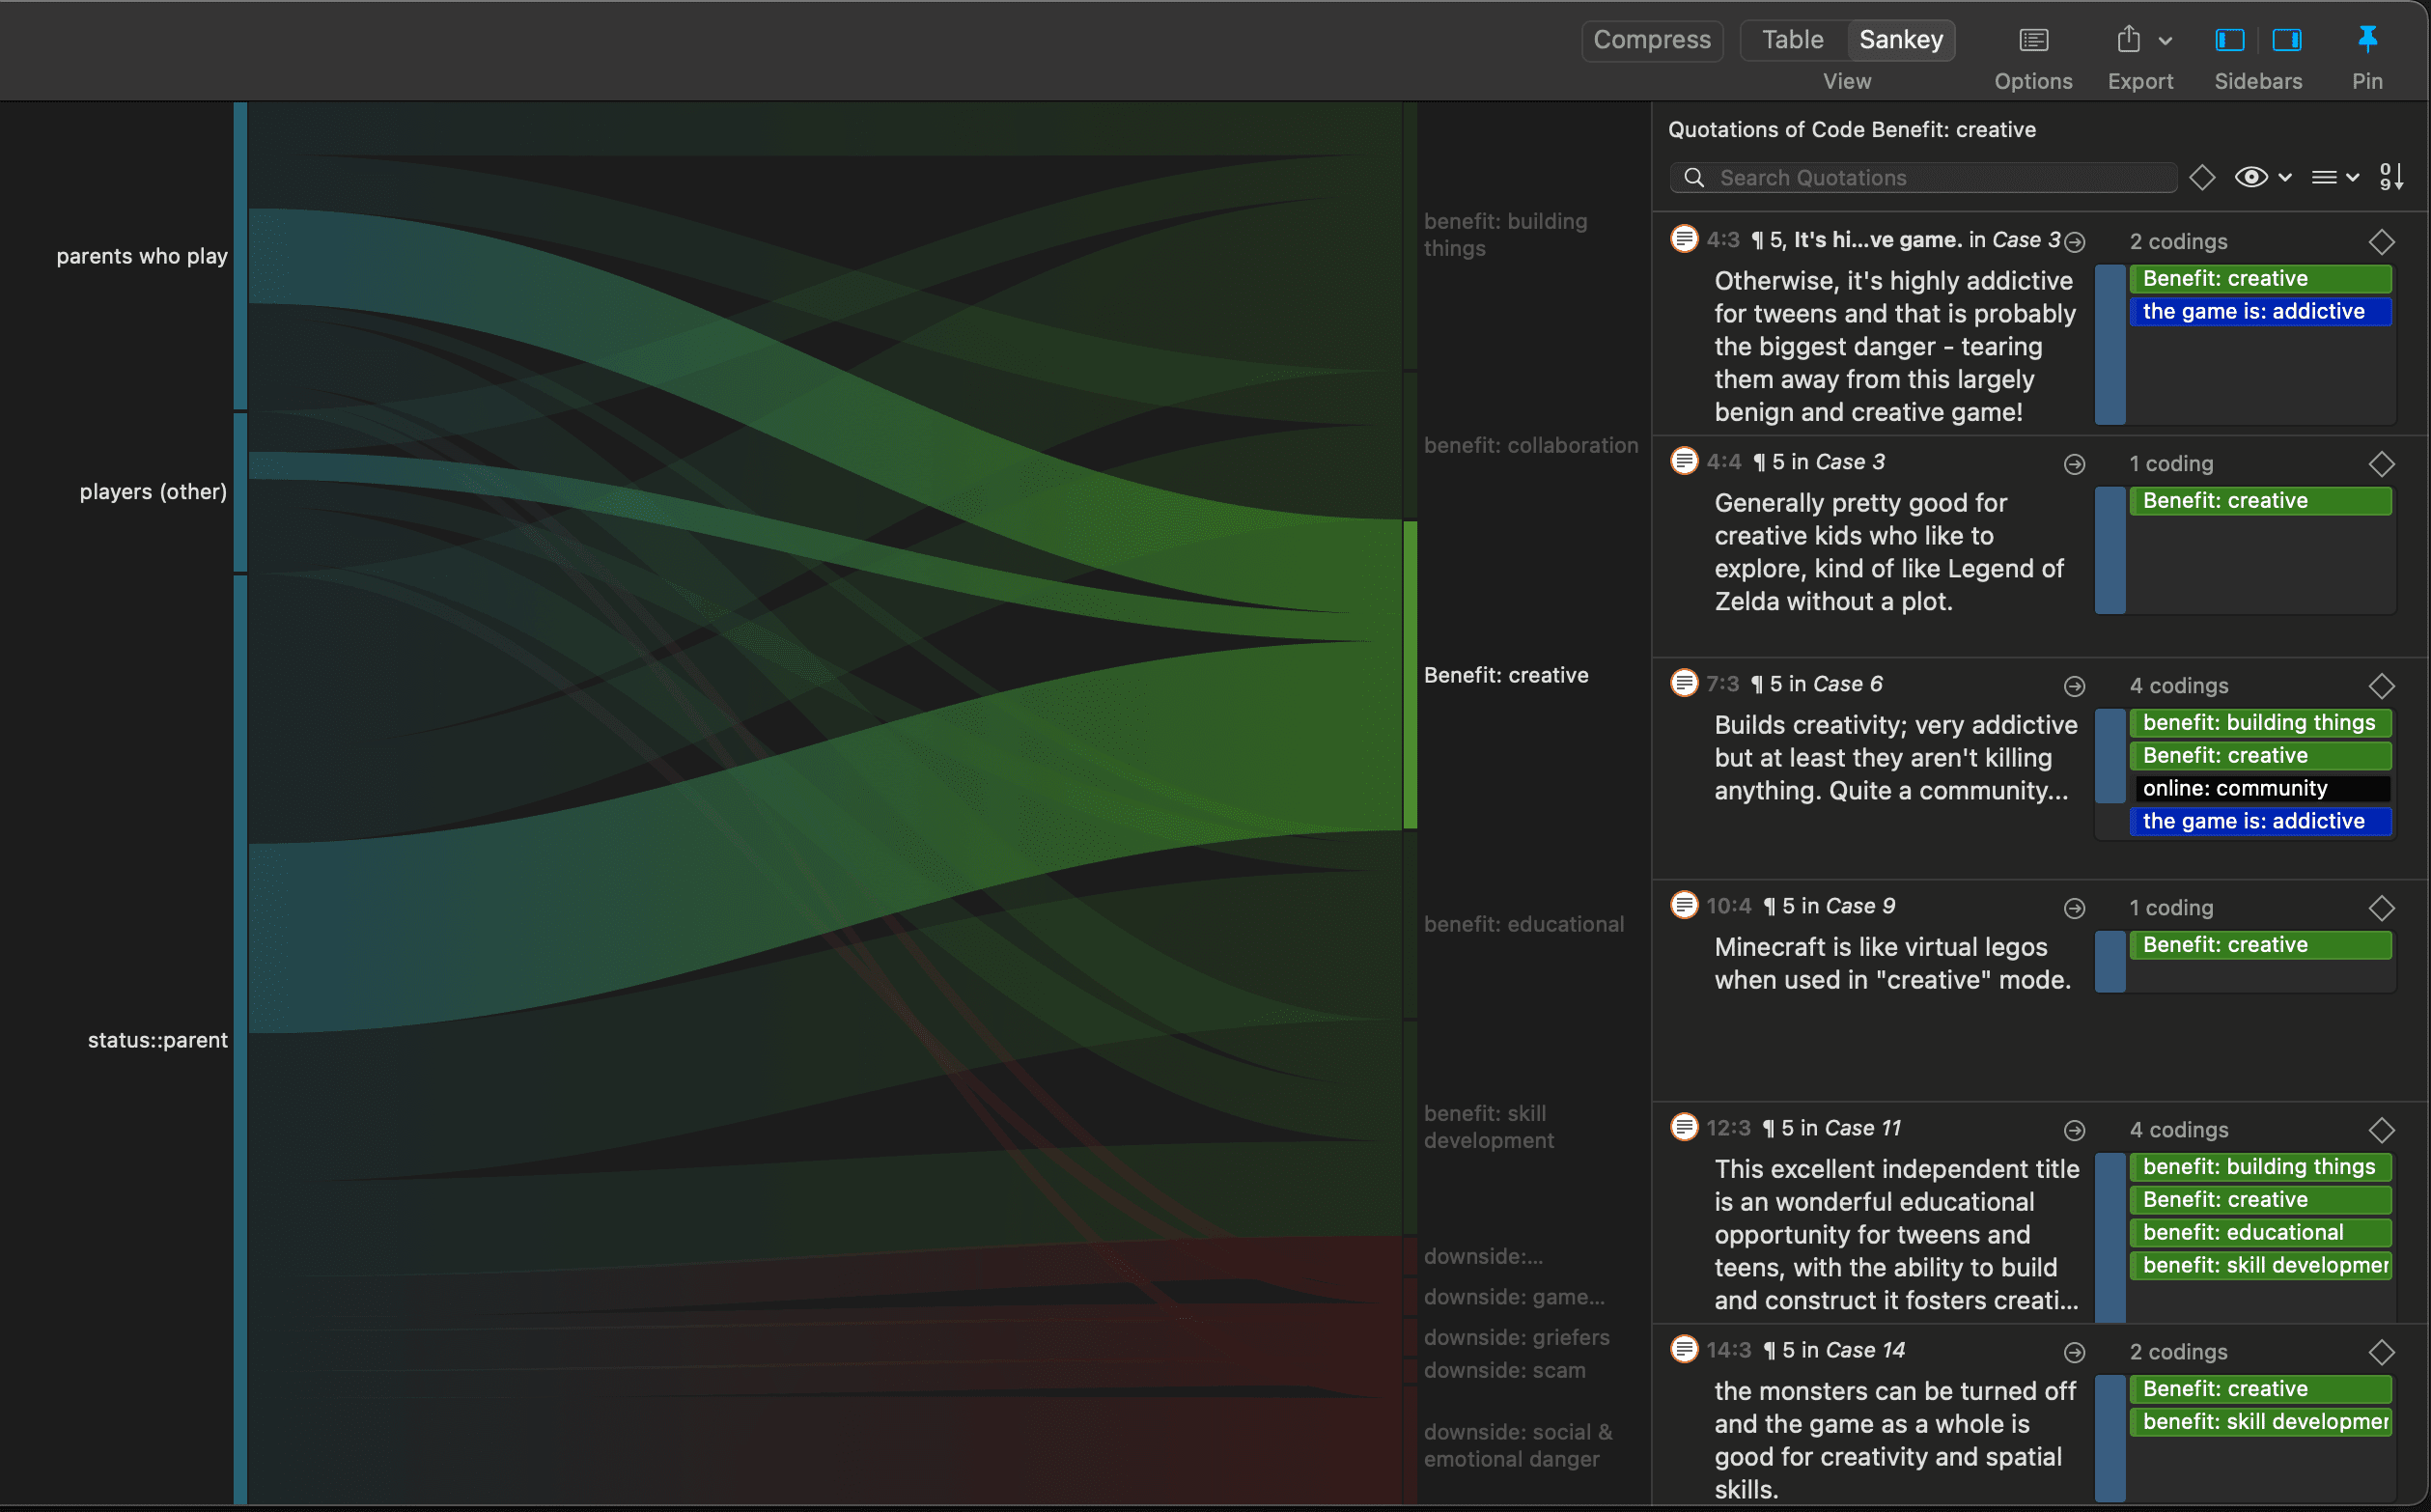
If you click on a cell in the table, the quotation content is shown in the Quotation Reader on the left-hand side. See image above.
-
the table cells are colored to reflect the frequency. The darker the color, the higher the frequency.
Code-Document Table Toolbar
Compress: This is a quick way to remove all rows or columns that only show empty cells. This is the same as manually deactivating codes or documents that yield no results. Thus, you cannot decompress a table.
Table / Sankey: You can switch between table view, and a visualization of the selected data in form of a Sankey diagram.
Options: See below.
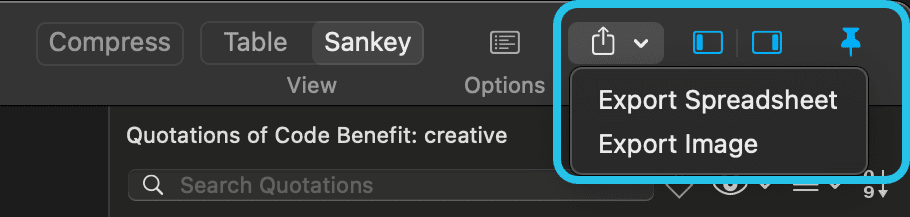
Export: You can export the table as Excel spreadsheet, and the Sankey diagram as image in pgn format.
Code-Document Table Options
Click on the options button to open the option pane.
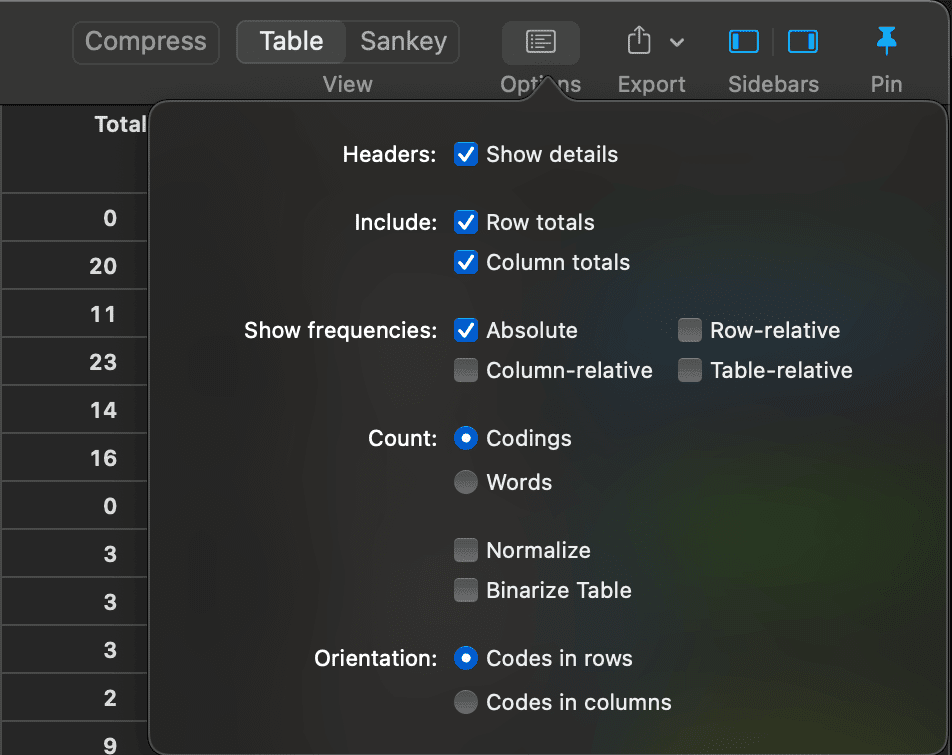
Headers: You can hide the additional information about number of quotations per code or document / number of members in a group you see in the table headers.
Include: Display/hide the row or column totals.
Show frequencies: You can display absolute frequencies, row / column / or table relative frequencies.
Absolute Frequencies: The table cells show the number of codings. This is the number of times a code is linked to a quotation. For single codes the number of codings is the same as the number of quotations, but for code groups it can differ if codes that are in the same code group have been applied to the same quotation.
-
Column Rel.-Frequencies: The table cells show relative frequencies based on the column cells. The total of each column will add up to 100%.
-
Row Rel.-Frequencies: The table cells show relative frequencies based on the row cells. The total of each row will add up to 100%.
-
Table Rel.-Frequencies: Display relative frequencies based on all codes used in the table. The totals of all row and column codes will add up to 100%.
-
Count: You can select to count the number of codings, or the number of words of the quotations.
-
Count Codings: Count the number of times a code has been applied to a quotation. Please note, the number of codings can be higher than the number of quotations if code groups are used as you can apply multiple codes to one quotation.
-
Count Words: Count the words of the quotations coded by the selected code, or the codes of the selected code group.
Normalize: If documents are of unequal length, or document groups of unequal size, the absolute frequencies might be misleading as a measure of comparison. Indicative are the total number of quotations in a document or document group (see top row).
If you normalize the data the number of codings are adjusted. As benchmark, the document / document group column or row with the highest total is used. For example, if you compare two documents, and the total number of codings for the first document is 100 and for the second document it is 50, then all codings of the second document are multiplied by 100/50 = 2. See Normalizing Data.
Binarize Table: This option reduces all cell values to 0 and 1. It shows whether a code, or codes of a code group, occur or do not occur in a document, or a document group. If they occur a black dot is shown; if not, the cell is empty. This makes it easier to identify a pattern in the data.
When you export the table to Excel, the dots are turned into 1s and the empty cells into 0s. This allows, for example, a discriminant analysis to be carried out in a statistical program. See Binarize Table.