
The Code Co-Occurrence Table
The Co-occurrence Table in comparison to the Code Co-occurrence Explorer shows the frequencies of co-occurrence in form of a matrix similar to a correlation matrix that you may know from statistical software.
The aim is to relate codes to each other that have been applied either to the same quotations or to overlapping quotations. You can find out which topics are mentioned together or are in proximity to each other. Thus, the results depend on how you have coded the data.
The Co-occurrence Table shows the frequencies of co-occurrence in form of a matrix similar to a correlation matrix that you may know from statistical software.
To open the tool, select the Analyze tab and from there the Co-Oc Table.
Next you need to select the codes that you want to relate to each other:
Select one or multiple codes from the first list for table columns, and from the second list for the table rows. You can switch around the rows and codes after the table has been created.
To select an item, you need to click the check-box in front of it. It is also possible to select multiple items via the standard selection techniques using the Ctrl or Shift-key. After highlighting multiple items, push the space bar to activate the checkboxes of all selected items, or right click and chose Check Selected from the context menu.
The context menu in each of the selection list also allows you to uncheck all selected codes, to select all codes, to unselect all codes, to invert the selection, or to invert the checked codes.
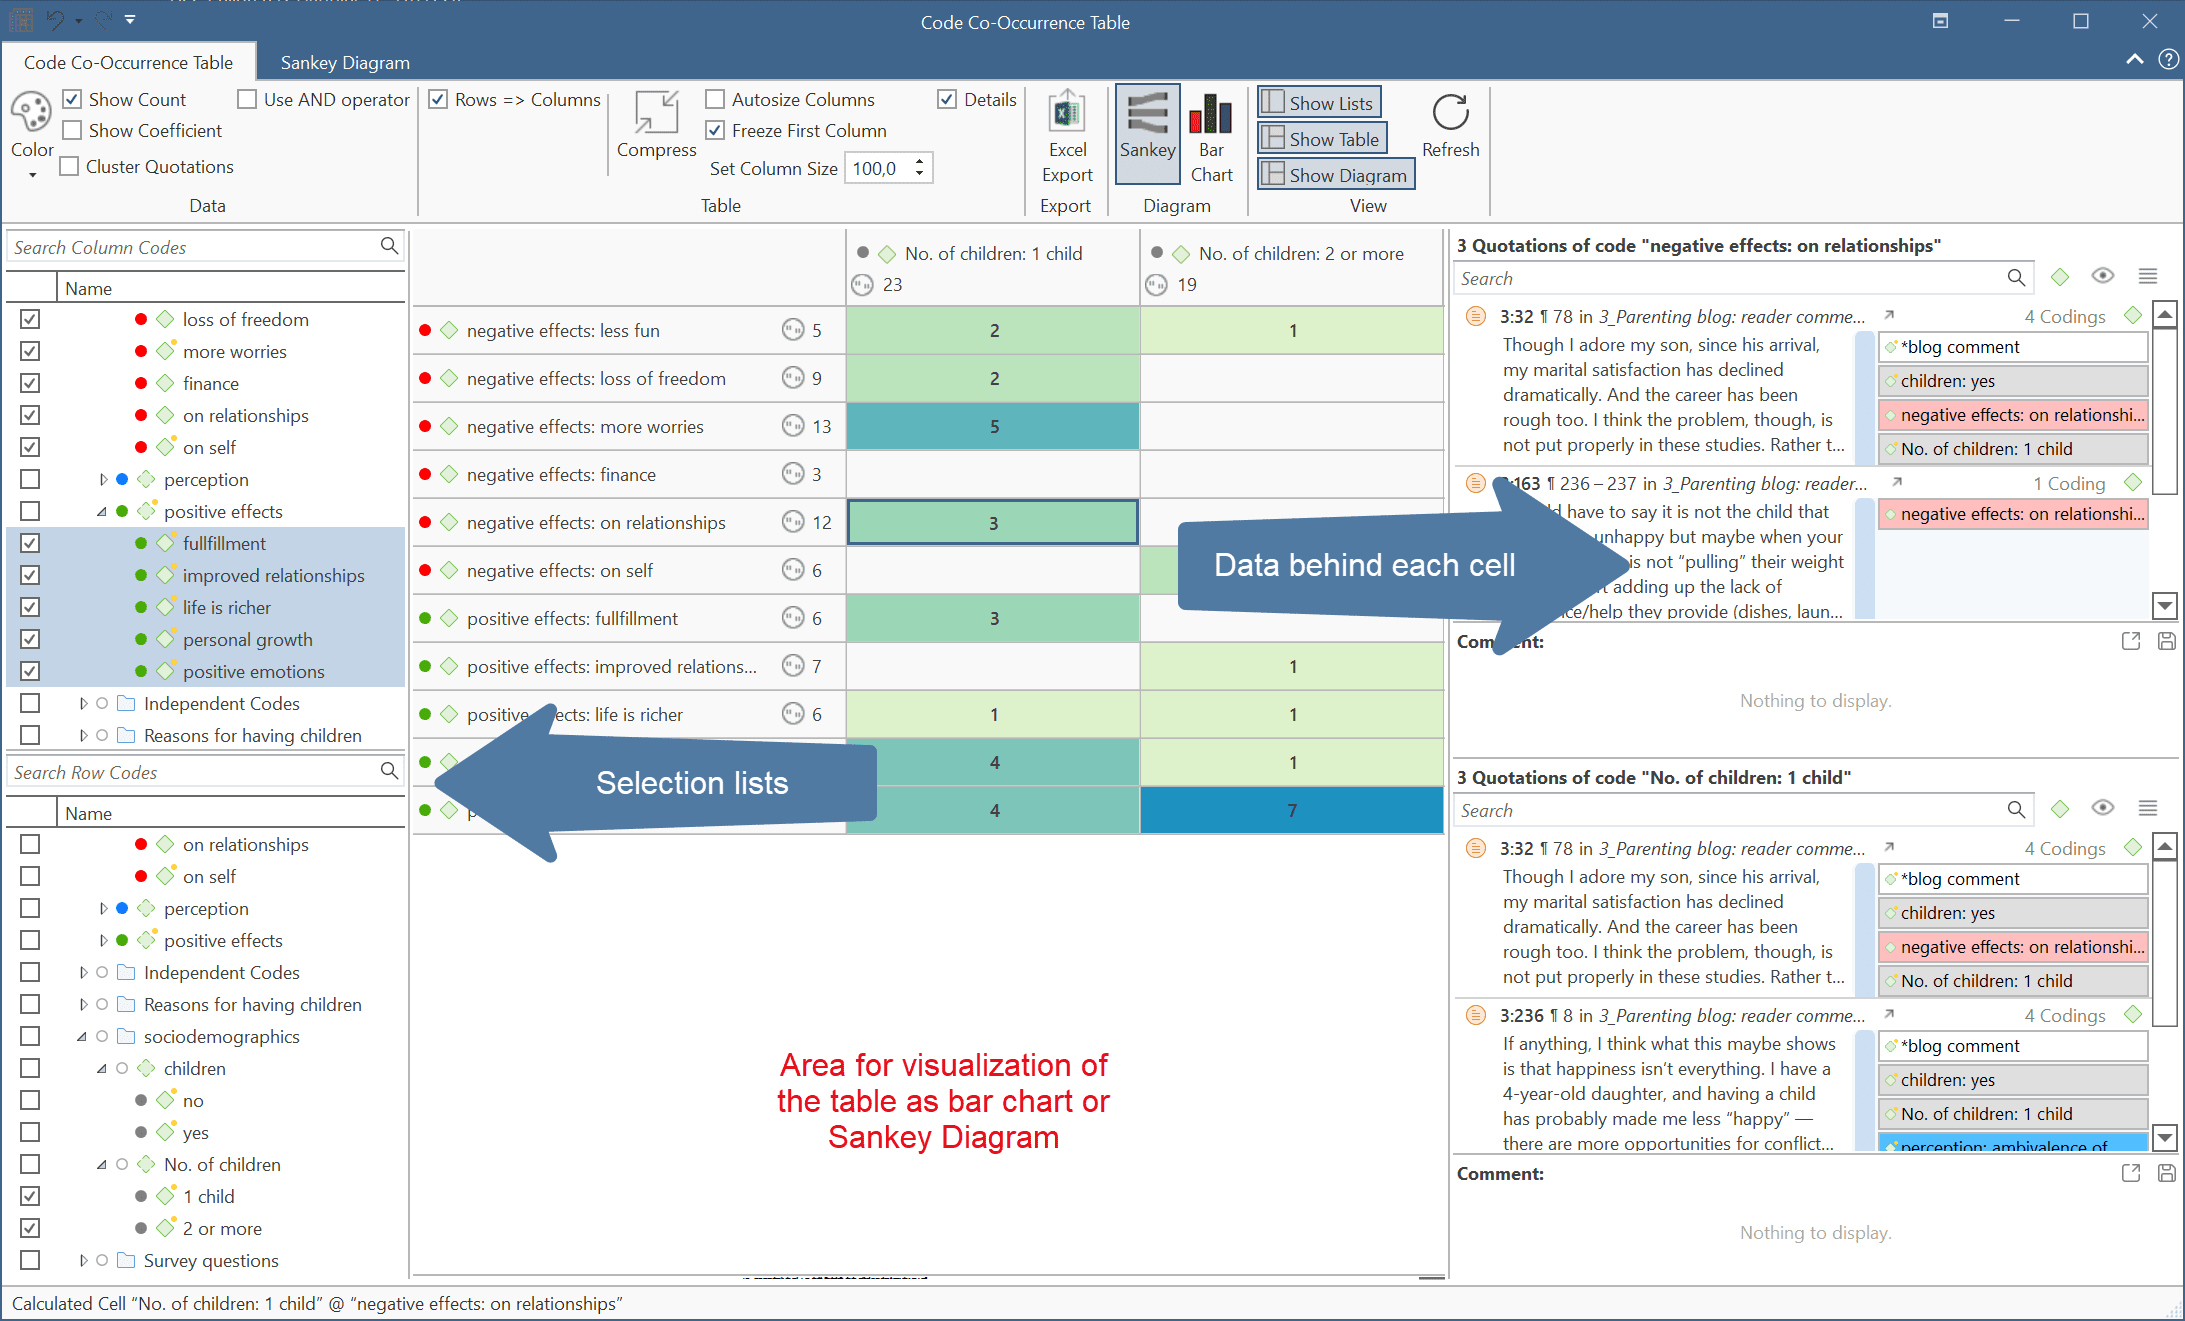
Below each table, you can select to see a Sankey Diagram or a Bar Chart that visualize the data in the table. See below for further information.
The table approach reduces the analysis to a pairwise comparison. If you need a higher order co-occurrence you can use the category codes instead of the subcodes.
If you want to compare code co-occurrences within subsets of your data, you can set a document group as global filter
How to Read the Table
-
First column / first row: The number below and behind each code shows how often the code is applied the entire project. This helps you to better evaluate the number of co-occurrences in the table cells.
-
The number in the cell indicates the number of hits, how often the two code co-occur. This means that the number of co-occurring „events" and not the number of quotations are counted. If a single quotation is coded by two codes or if two overlapping quotations are coded by two codes, this counts in both cases as a single co-occurrence.
-
If you click on a cell, the quotations of the corresponding row and column codes are displayed next to the table in the Quotation Reader. The quotation reader here always displays two lists of quotations: the quotations of the column code, and the quotations of the row code.
Code Co-Occurrence Table Ribbon
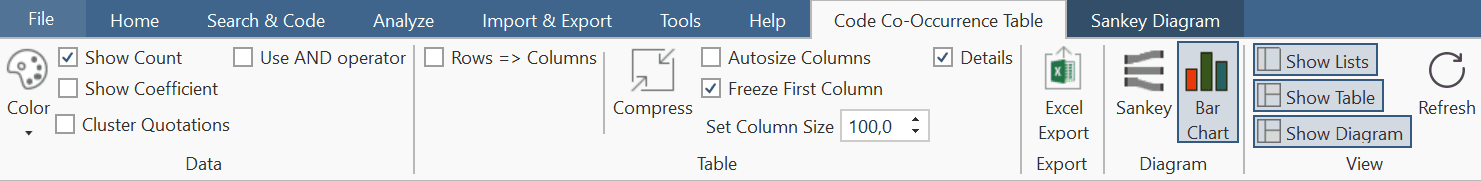
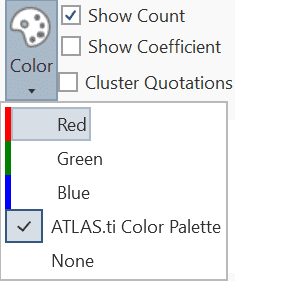
Colors: You can choose among three colors for the table cells (blue, red and green), the ATLAS.ti color palette (default), and no coloring. If you select a color, or the ATLAS.ti color map, the table cells are colored in different shades.
Show count: Show the number of co-occurrences (=number of hits, see above: How to read the table).
Show Coefficient: The c-coefficient gives you an indication of the strength of the relationship between the pair of codes. See C-Coefficient for more detail.
Cluster quotations: Activate this option, if you want to count embedded quotations only once. If code 'A' codes a larger segment and within this segment, there are three quotations coded with a code 'B', the number of co-occurrences is 3. With clustering activated, the count is 1.
Use AND operator: If you activate this option, the table values are calculated based on an 'AND' occurrence and not the more general code 'co-occurrence' operator. See the section on Proximity Operators for further detail.
Rows => Columns: Select to switch row and column codes.
Compress: This is a quick way to remove all rows or columns that only show empty cells. This is the same as manually deactivating codes that yield no results. Thus, you cannot "uncompress" a table.
Auto Size Columns: Adjust the size of the columns automatically so that the full label is shown.
Freeze first column: Set if you do not want the auto size option to affect the first column.
Set Column Size: You can manually set the column size. '100' means that the column is as wide as the full label.
Details: If activated, you see the total number of times the code has been applied to a quotation. This helps you to better evaluate the numbers in each cell. The interpretation is likely different if the number of hits is 10 and if each of the codes have been applied 50 or only 15 times.
Export: You can export the table to Excel.
- If Show Count is selected, only the number of co-occurrences are exported.
- If Show Coefficient is selected, only the c-coefficient and not the absolute number of hits are exported.
- If you have selected both, both are exported.
Sankey: Visualize the table as Sankey Diagram. See more in the chapter on co-occurrence visualization.
Bar Chart: Visualize the table as bar chart. See more in the chapter on co-occurrence visualization.
Show Lists: If you only want to see the table and/or the graphs and not the selection lists, deactivate this option.
Show Table: If you only want to see the bar chart or the Sankey Diagram without the table, deactivate this option.
Show Diagram: If you only want to see the table, deactivate this option.
Refresh: If you make modifications to your codings while the table is open, you can click the Refresh option to update the results.