
Code-Document Table: Relative Frequencies
Relative frequencies are useful for comparing code distributions across or within documents or document groups, as percentages are easier to comprehend.
If documents are of unequal length, or if document groups have an unequal number of members, it is recommended to normalize the counts as absolute counts may distort the results. See Data Normalization.
Across Group Comparison: Row Relative Frequencies
 Code-Document Table showing an example of an across-group-comparison
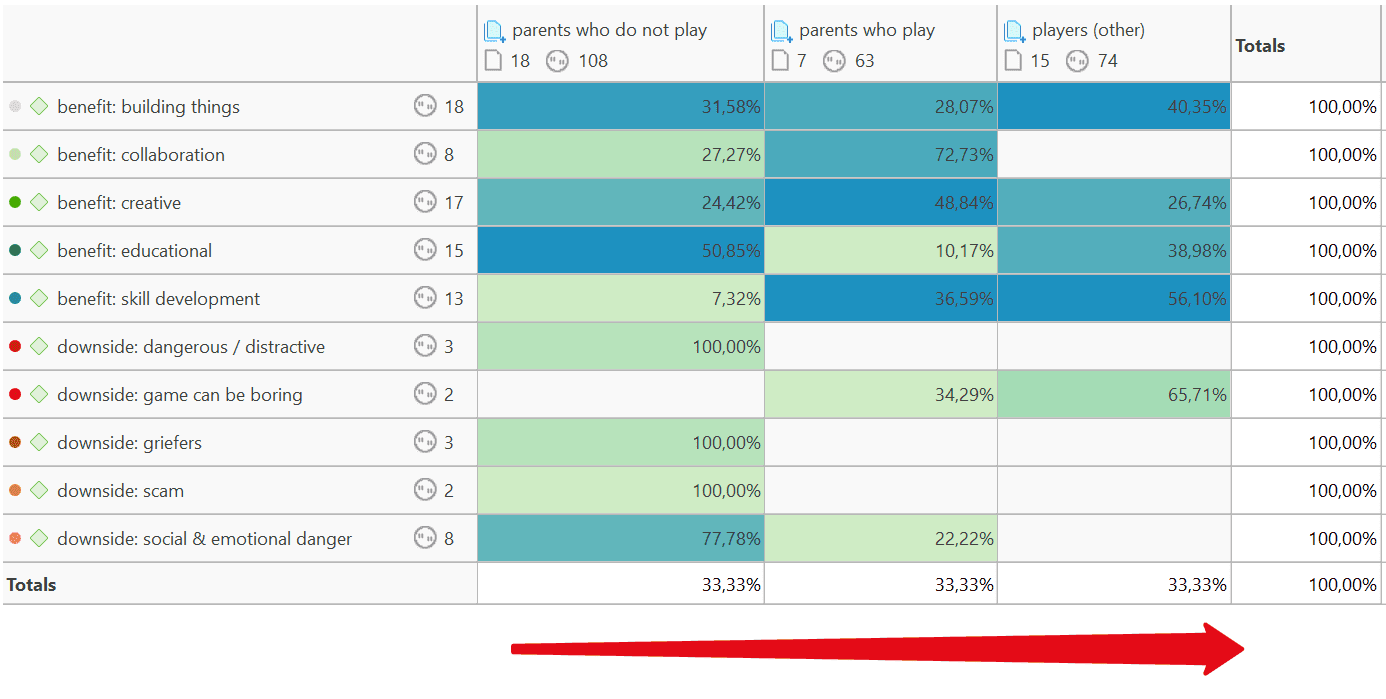
The table shows data from a survey with open-ended questions where people evaluate the computer game Minecraft. You can download the project here.
You must read this table from left to right along the rows. It shows the distribution of the selected codes across the following three document groups:
- parents who do not play Minecraft themselves
- parents who play
- player, who are not also parents
A quick glance of the heat map indicates that people who play (parents or others) mention more benefits than parents who do not play. The latter group appears more concerned with the downsides of playing a computer game, especially with the social and emotional dangers. Players mention very few downsides.
Whether you need to select row or column relative frequencies depends on which way around the table is displayed. If documents/document groups are listed as rows and the codes as columns, you use row relative frequencies for a within group comparison.
Within Group Comparisons: Column Relative Frequencies
The following example is from the sample project: Children & Happiness. Compared are in what kind of relations the readers wrote about positive and negative experience of parenthood.
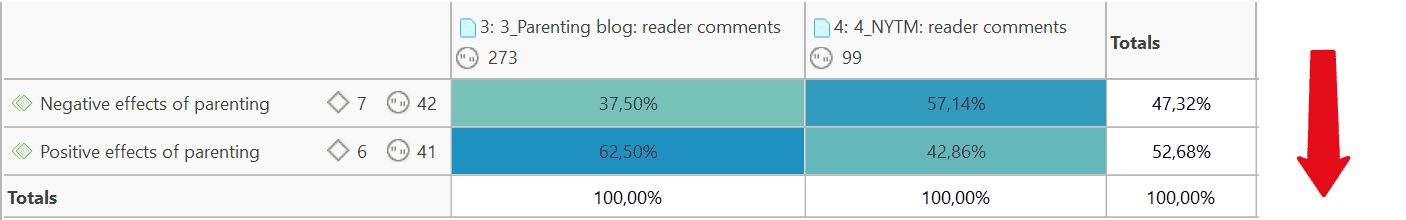 As can be seen from the table, the readers from the parenting block write relatively speaking more about positive aspects of parenting as compared to the readers of the NYTM article.
Total Relative Frequencies
If you select total relative frequencies, the calculation is based on the total number of codings of all selected codes in the table. Below it is compared who has provided more or fewer reasons for having or not having children:
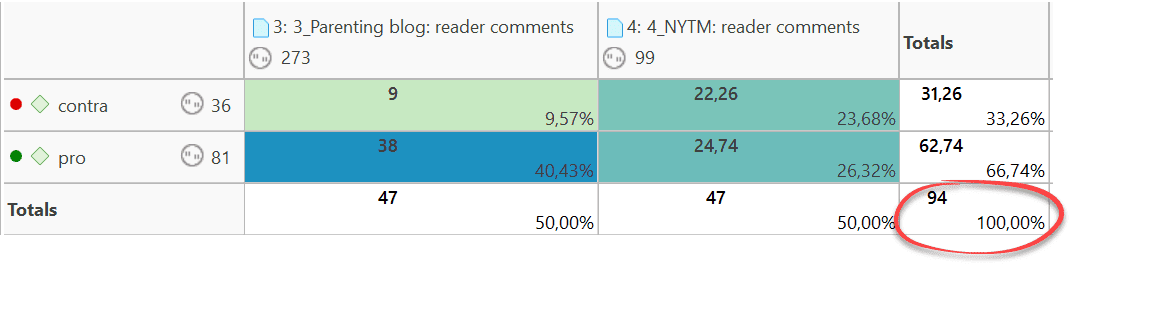 Example application of total relative frequencies
Readers of the parenting blog have given 38 / 94 = 40,43% of the reasons for having children and 9/94 = 9.57% of the reasons for not having children
Readers of the NYTM article have contributed 24,7/94=26,32% of the reasons for having children and 22,26/94=23,68% of the reasons for not having children (the data have been normalized).
Thus, comparatively, the readers of the NYTM articles have given quite a few more reasons for not having children, which fits the results reported above that they also wrote more about negative effects of parenting.
You can display all values: absolute frequencies and all relative frequencies in one table by selecting all options. It depends on the purpose for which you want to use the table. For interpreting the data, it is probably easier if you look at each of the relative frequency counts separately. For a comprehensive report for an appendix, you may want to export the table with all options included.