
Importing Survey Data
If you import the same table repeatedly, rows with already existing documents are ignored. This way, you do not have to wait until the last respondent has filled out the questionnaire.
When importing the same data again with updated information, you can only import new cases (i.e. rows in Excel), but not new questions (i.e. columns in Excel).
Select the Import & Export tab and then the Survey button.
Inst
Select the Excel file to be imported and click Open.
A wizard opens that guides you through the next steps:
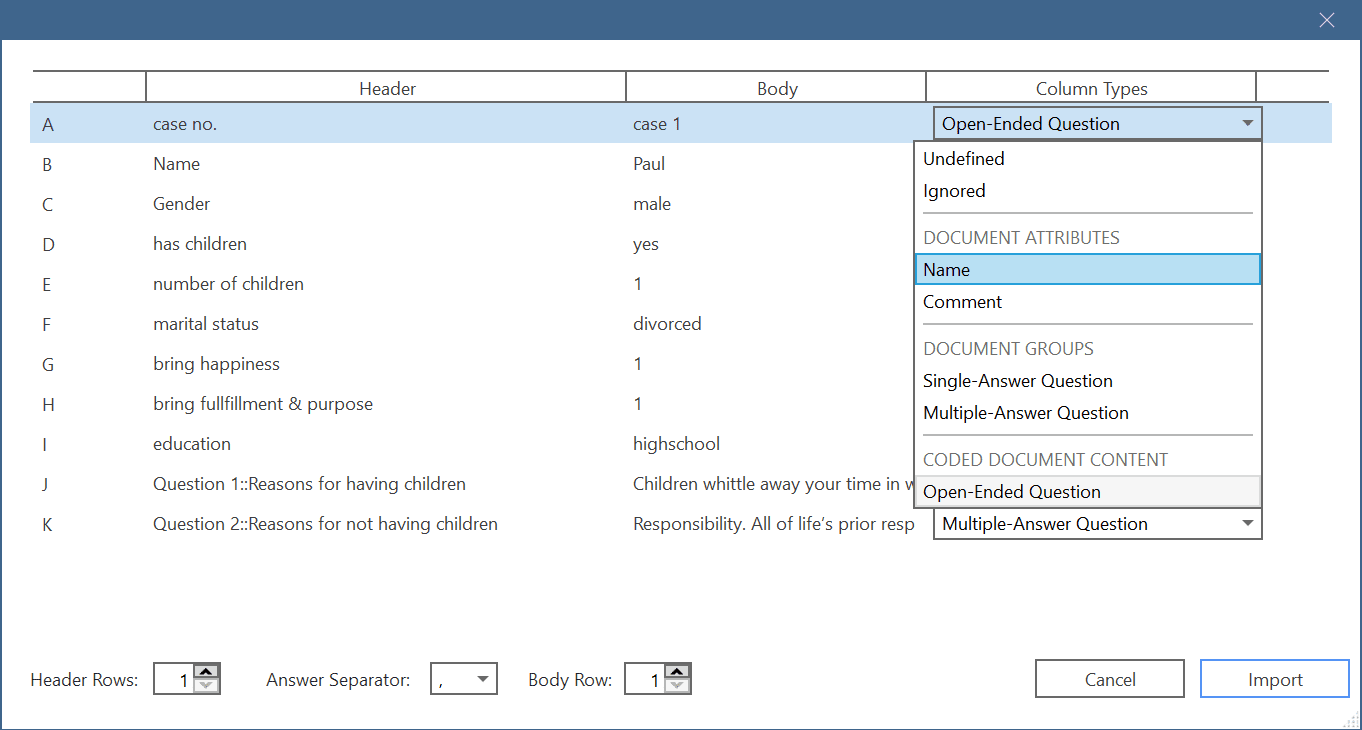 For each table column you can decide whether it should be transferred into a document attribute, a document group, or content of a coded document. You can also exclude columns.
Undefined: ATLAS.ti tries to make an educated guesses for each column. If this is not possible, then 'undefined' is entered. You then need to select a suitable option. The data cannot be imported if some columns are set to 'undefined'.
Ignored: Select if you do not want to import this column. We recommend that you clean up your table beforehand in Excel and remove everything that you don't want to import to ATLAS.ti. This will facilitate the import.
Document Attribute: name: use the content of each cell in this column as document name. You can also select more than column to make up the name as shown in the example here. If both 'case no.' and 'Name' are chosen to become the document name, the document name will be 'case 1 Paul', 'case 2 Anne', 'case 3 Toni', etc. You can use the Body row option in the toolbar at the bottom of the wizard to move through the contents of each row.
Document Attribute: comment: Use the information in this column as document comment.
Document Group: single-answer question: If you have a question where you ask respondents to indicate their marital status, and the possible answer choices are: single, married, divorce, then ATLAS.ti creates a document group for each of these values:
- martial status::single
- marital status::married
- marital status::divorce
Document Group: multiple-answer question Use this option, if respondent can give multiple answers to one question. For example: "What are your favorite flavors of ice cream? Select any that you like." ATLAS.ti will create a document group for each answer choice. The default answer separator is a comma (,). See the bottom section of the wizard. Adjust the separator, if a semicolon (;) is used.
Coded document content: open-ended question: All answers that should become part of the body of the document.
Toolbar

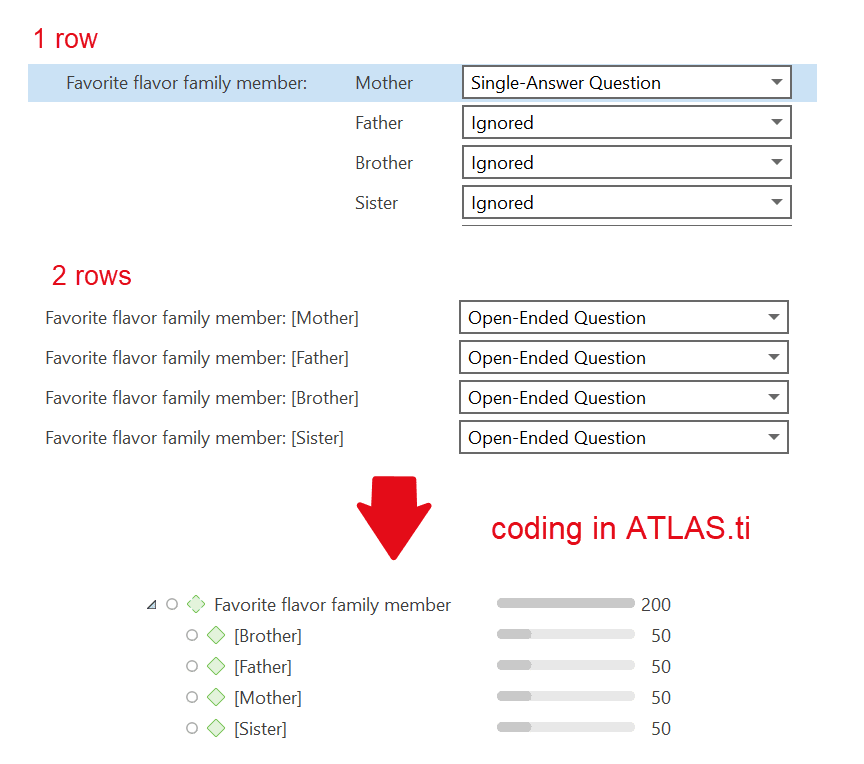
Header Rows
Some survey apps use two header rows as header, like Survey Monkey for instance. This means, your Excel output could look like this:
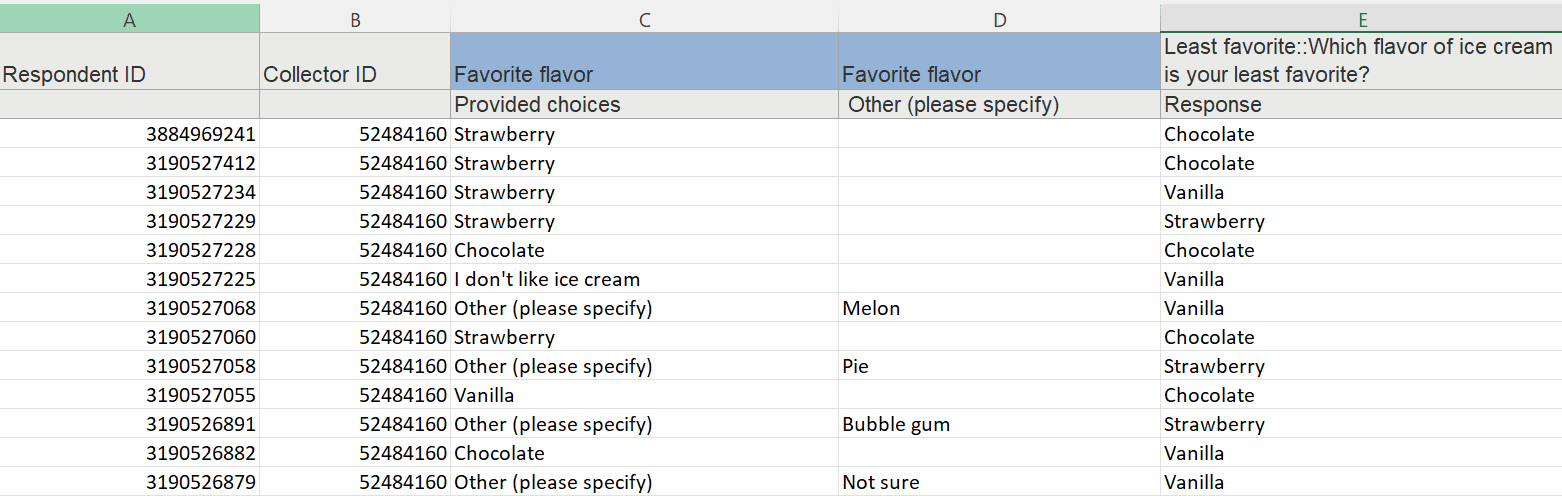
If this is the case, you need to change the header rows from 1 to 2. Below you see an example:
Inspecting Imported Survey Data
Open the Document Manager and take a look at what has been added to the project:
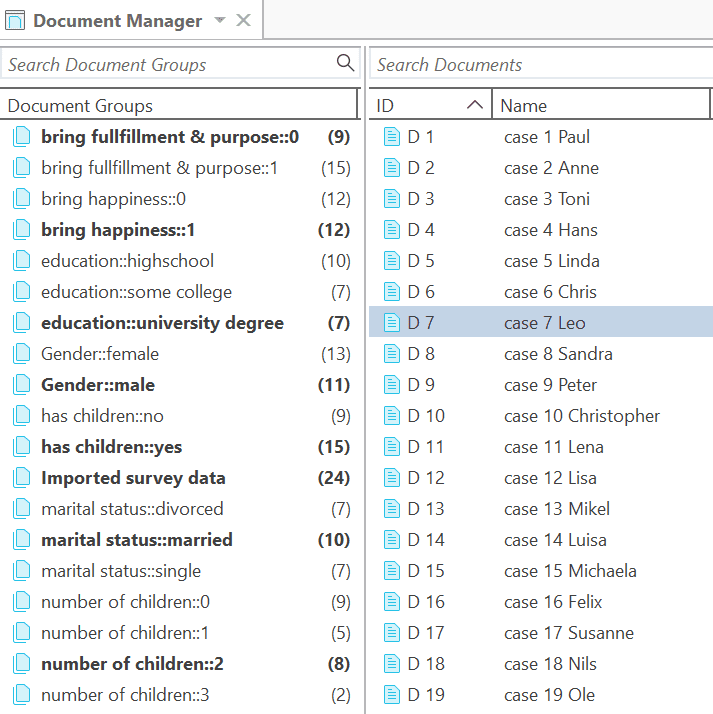 Document names: If you do not specify a name for each case, the default is case 1, case 2, case 3 and so on. In the example shown here, the case no. and the name is used as document name.
Document groups: Based on the information provided in the Excel table, document groups are created. The highlighted respondent 'case 7 Leo' in the example has a university degree, is a male, is married, and has 2 children. He answered the question: 'Do children fulfillment & purpose' with yes.
ATLAS.ti automatically creates a group that contains all survey data in case you work with data from multiple sources.
Data: The document text for each case consists of the answers to the open questions. Each answer is automatically coded with the information provided in Excel. The code can just be the question number or a longer label.
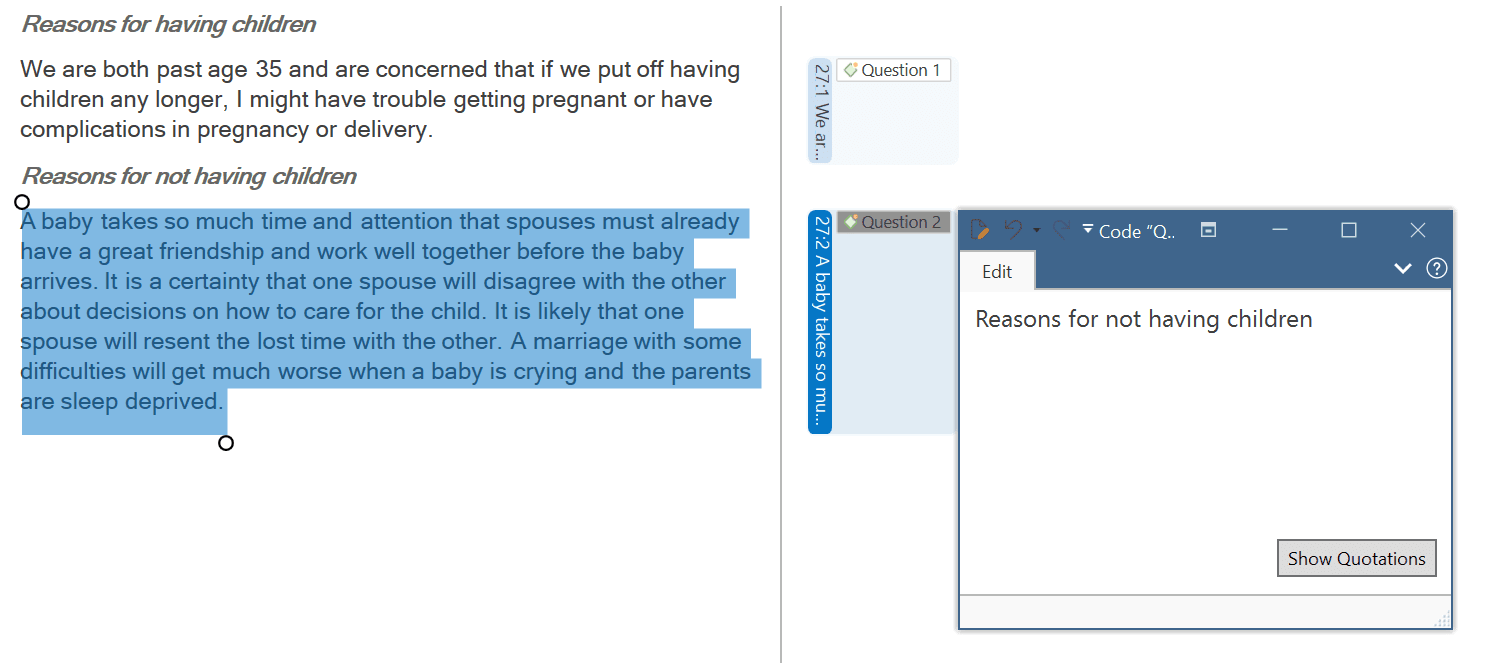 You can now begin to add some more detailed coding for each question. Useful tools that help you to quickly gain insights into your data are sentiment analysis and letting ATLAS.ti look for concepts.
For a comparative analysis based on the document groups that have been created, you can use the Code Document table:
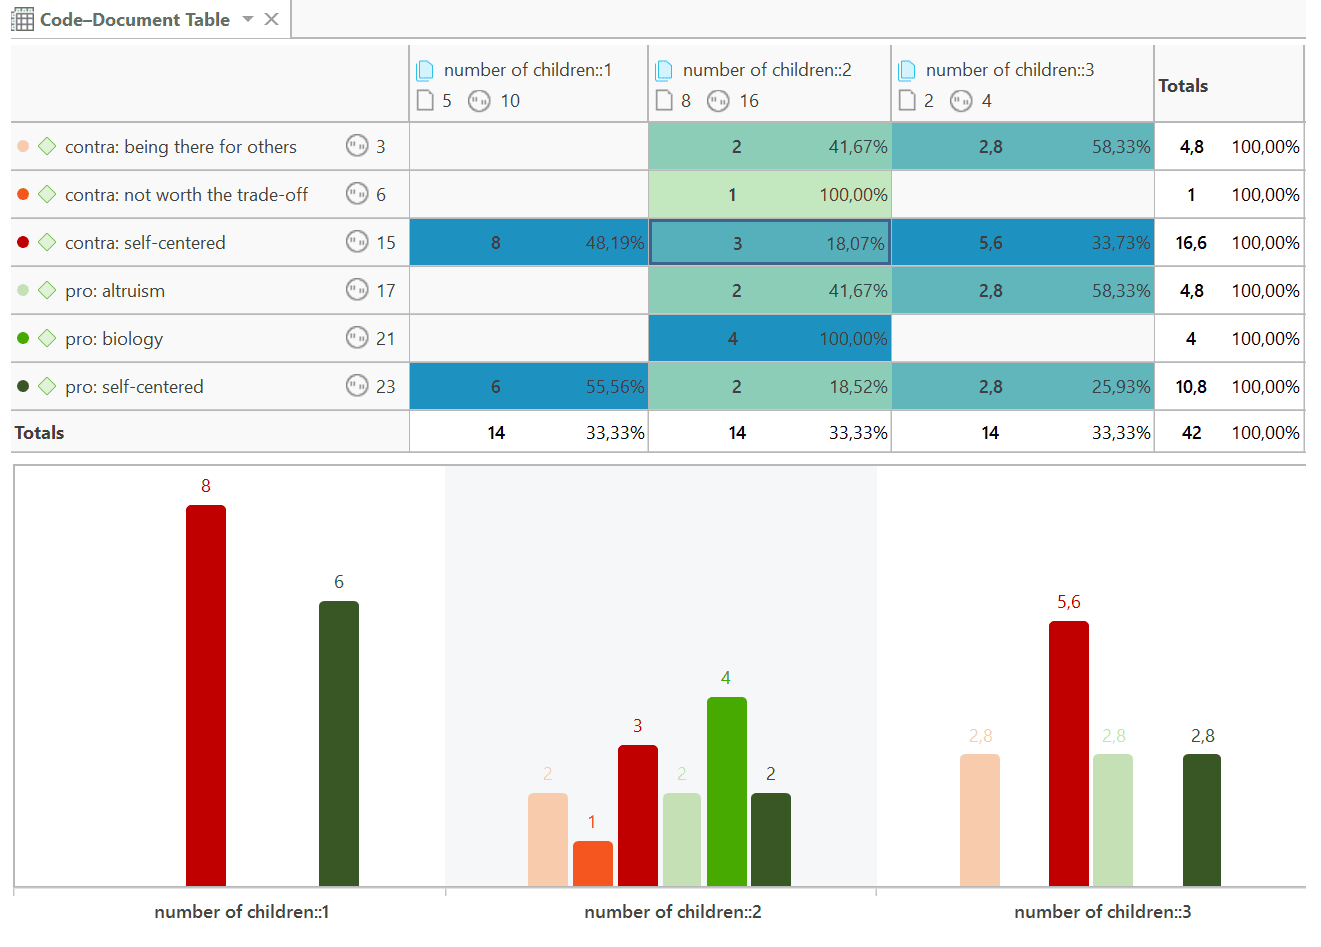 The image above shows a comparison of respondents with 1, 2, and 3 children. Compared are the kind of reasons they give pro and contra having children.